- AUD/JPY stays positive despite failing to cross 100-day SMA the previous day.
- Bullish MACD portrays another attempt towards clearing the key upside hurdles.
AUD/JPY seesaws around 75.00 during the early Thursday morning in Asia. The pair rose to a three-week high the previous day but couldn’t provide a daily close past-100-day SMA, needless to mention about stepping back from a falling trend line from August 31.
Even so, bullish MACD signals join the bulls’ ability to keep 75.00 on the chart while suggesting another run-up towards the important levels to the north.
Should the AUD/JPY prices break the stated resistance line and 100-day SMA, respectively around 75.40 and 75.50, the 76.00 round-figure and October’s high near 76.50 will be in the spotlight.
Meanwhile, late-October highs near 74.95 offer immediate support to watch during the quote’s fresh weakness, a break of which can aim for September’s bottom surrounding 73.95 ahead of directing the AUD/JPY bears to the previous month’s low of 73.13.
AUD/JPY daily chart
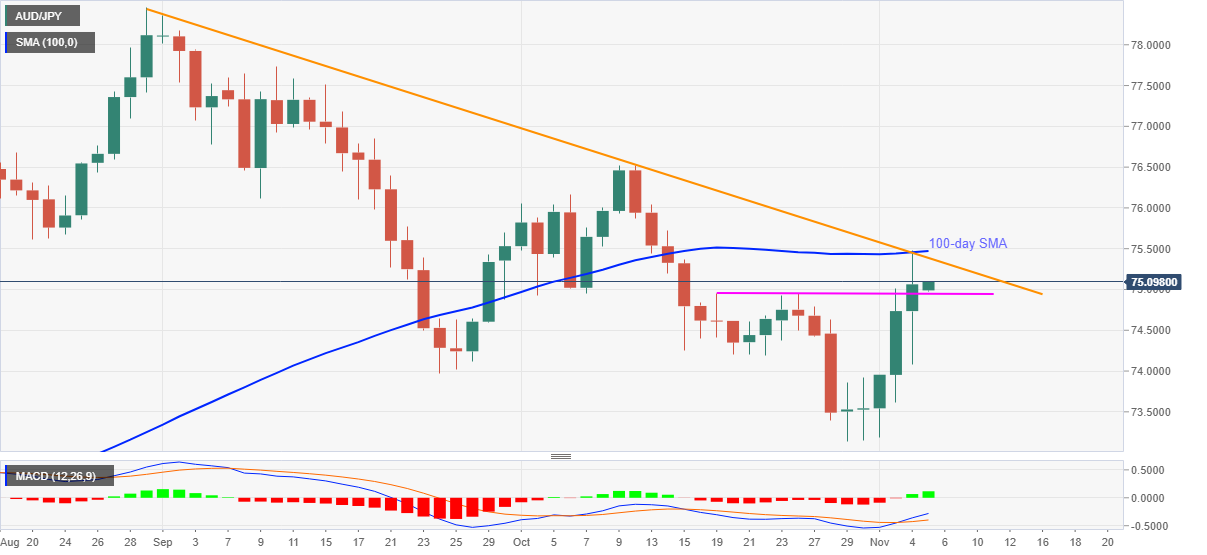
Trend: Bullish
