- AUD/JPY bounces off a multi-week long falling trendline.
- 100-day SMA, 61.8% Fibonacci retracement question buyers amid bullish MACD.
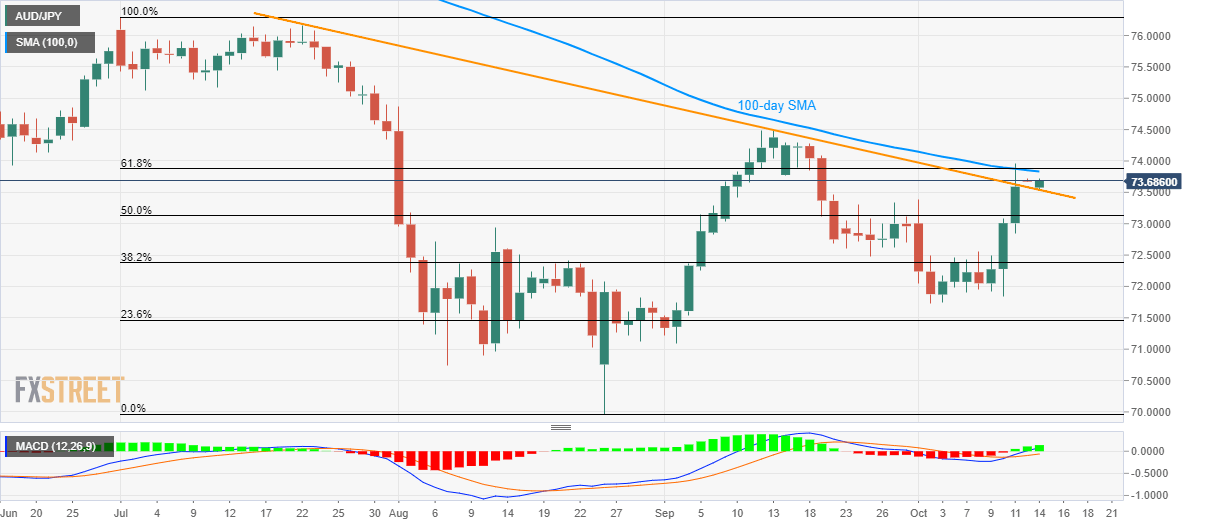
Despite taking a U-turn from resistance-turned-support, the AUD/JPY pair is yet to clear near-term key resistance-confluence as it takes the bids to 73.70 during early Monday morning in Asia.
The pair respects bullish signal of 12-bar Moving Average Convergence and Divergence (MACD) while bouncing off a downward-sloping trend-line since late-July. However, bulls need a confirmation as 73.83/88 resistance area, comprising 100-day Simple Moving Average (SMA) and 61.8% Fibonacci retracement of July-August downpour, remains untouched.
Should prices rally beyond 73.88 on a daily closing basis, September month high near 74.50 becomes buyers’ favorite whereas early-July lows close to 75.10/20 could question further upside.
Alternatively, pair’s declines below the resistance-turned-support line of 73.58 highlight 50% Fibonacci retracement level of 73.13 as following rest.
In a case where the pullback lasts longer below 73.13, 72.50 and monthly bottoms around 71.70 could lure bears.
AUD/JPY daily chart
Trend: pullback expected
