- AUD/JPY looks set for corrective rally.
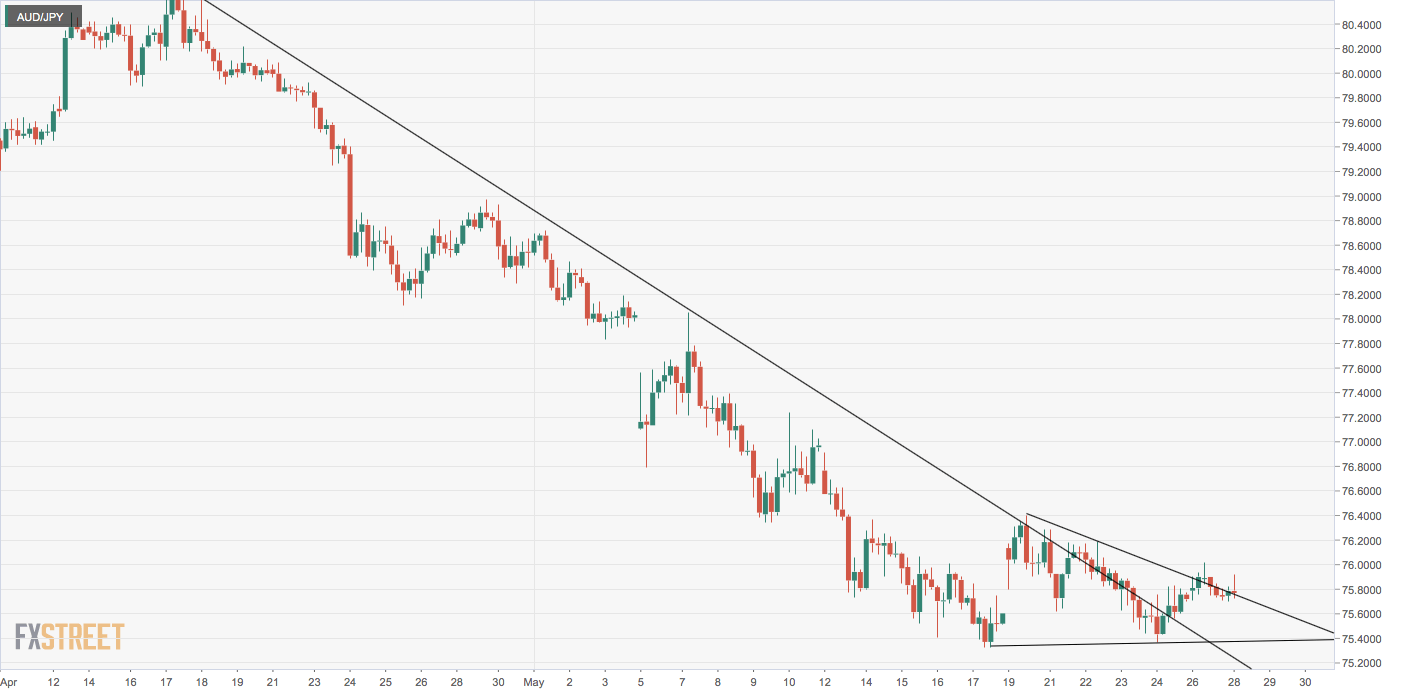
- 4-hour chart shows contracting triangle breakout.
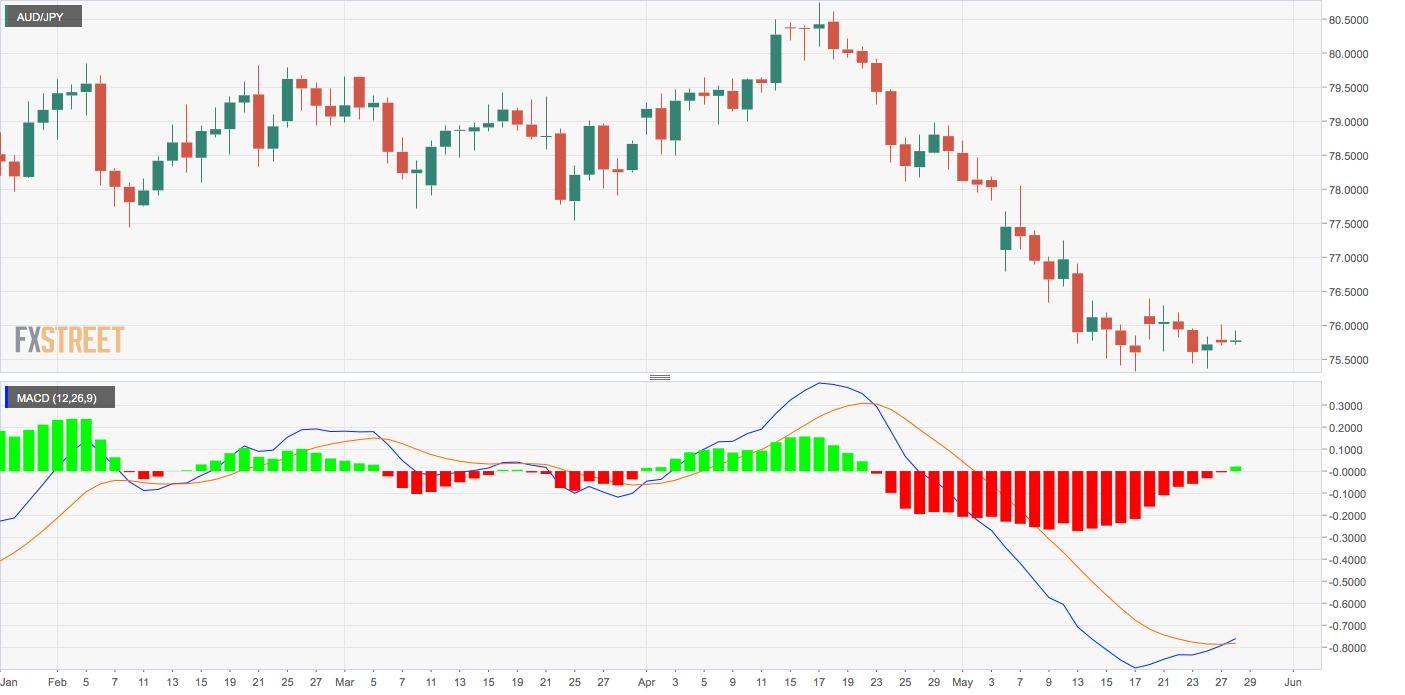
- A key daily indicator has turned bullish.
AUD/JPY is currently trading at 75.84 and could rise well above 76.00 over the next few hours, as per technical charts.
For instance, the previous 4-hour candle closed at 75.88, confirming a contracting triangle breakout and validating the descending trendline’s violation seen in the
US trading hours.
Further, on the daily chart, the moving average convergence divergence (MACD) histogram has crossed above zero live – a sign of bearish-to-bullish trend change.
The rise to levels above 76.00, however, could be short-lived if the equities remain risk averse. As of writing, the futures on the S&P 500 are reporting 0.5% gains.
4-hour chart
Daily chart
Trend: Bullish
Pivot levels
