- AUD/JPY pulls back from 100-ay EMA.
- Bearish MACD shifts market attention to near-term key supports.
Despite marking the best day in a month on Friday, AUD/JPY sellers sneak in around 100-day EMA as the pair declines to 74.07 amid initial Asian trading on Monday.
In addition to the pair’s failure to cross key Exponential Moving Average (EMA), the bearish signal from 12-bar Moving Average Convergence and Divergence (MACD) also favors the pair’s extended pullback towards 50-day EMA level around 73.95.
Though, an upward sloping trend line since August 26, at 73.44 now, could restrict the quote’s further downside, if not then 73.00 and early-October top near 72.55 could flash on bear’s radar.
Alternatively, pair’s sustained daily closing beyond 100-day EMA level of 74.18 can trigger fresh run-up to November 07 low surrounding 74.60 whereas 200-day EMA, close to 75.45 will be in the spotlight afterward.
AUD/JPY daily chart
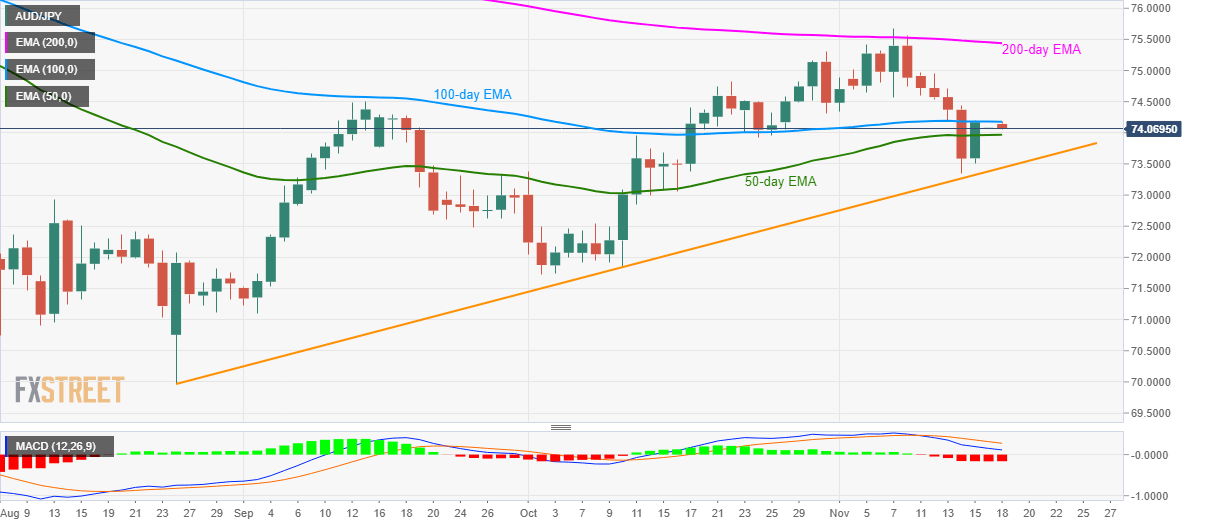
Trend: Pullback expected
