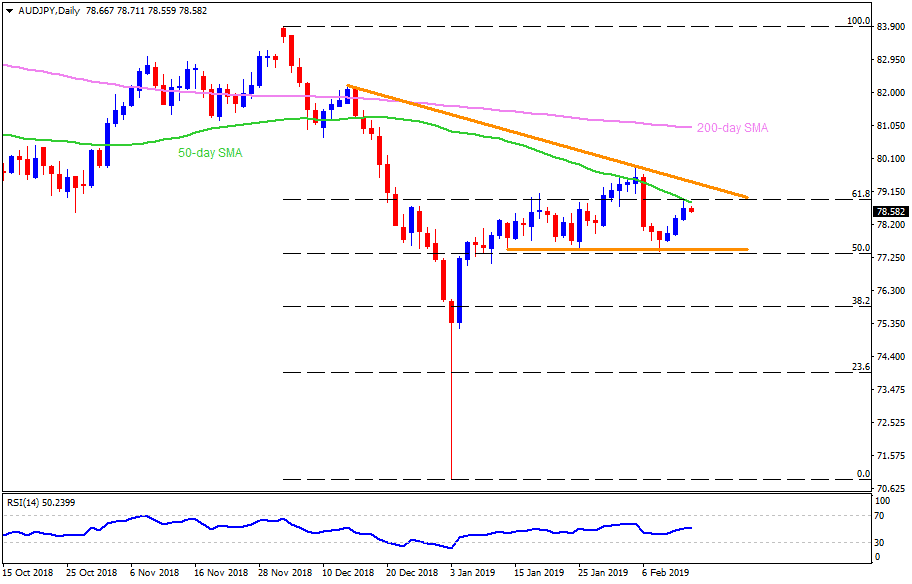
AUD/JPY daily chart
- The AUD/JPY pair remains little changed near 78.67 during early Asian sessions on Thursday.
- The pair surged to a week’s on yesterday but fall short of clearing 50-day simple moving average (SMA) and 61.8% Fibonacci retracement level of its December – January downturn.
- The same confluence region around 78.85-95 presently restricts the quote’s immediate upside.
- In addition to 78.85-95, a two-month-old descending trend-line figure of 79.45, followed by 80.00 mark, could also challenge the buyers.
- Meanwhile, 78.50 and 77.80 may offer nearby support to the pair ahead of highlighting 77.55-50 support-area.
- During the pair’s extended downturn past-77.50, 77.00 and 76.00 may gain sellers’ attention.
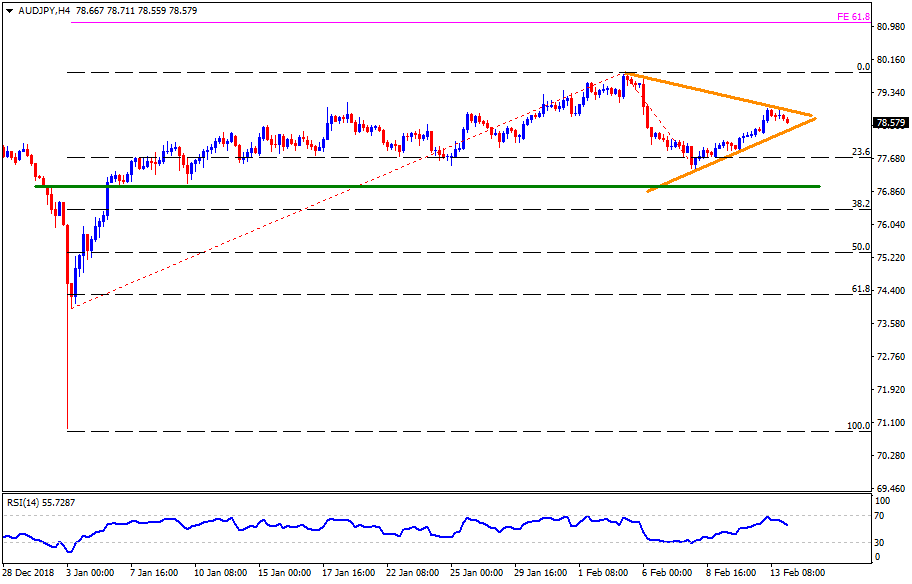
AUD/JPY 4-Hour chart
- Symmetrical triangle restricts the pair moves between 78.35 and 78.90 on H4.
- Break of 78.35 may recall 78.10 and 77.50 supports whereas 77.00 might confine the declines afterward.
- In case prices manage to surpass 78.90, their surge to recent high around 79.85 and then to 81.00, including 61.8% Fibonacci expansion (FE) of its early-January to February move.
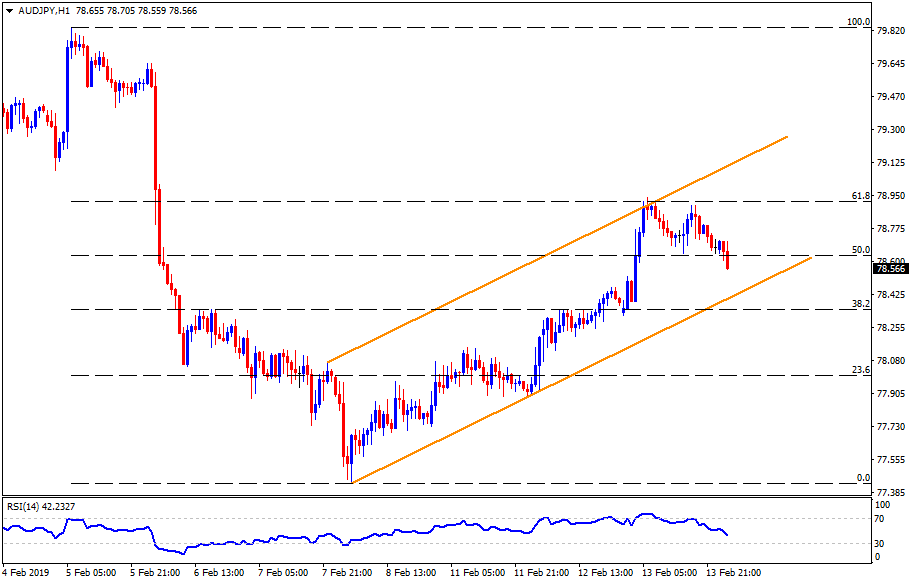
AUD/JPY hourly chart
- Ascending trend-channel support, at 78.35 may become an immediate concern for the sellers ahead of aiming 78.15 and the 77.50.
- Alternatively, 78.90 and channel resistance figure of 79.10 can limit immediate advances, a break of which can escalate the recovery to 79.50.