- AUD/JPY trades between the key technical indicators after Monday’s negative closing.
- The three-week-old rising trend line, 200-day EMA and 50% Fibonacci retracement can challenge sellers.
- Buyers will look for the clear upside break ahead of targeting March month lows.
AUD/JPY seesaws near 76.20 during the early Tuesday morning in Asia. The pair awaits confirmation of the previous day’s losses that were the first in three days.
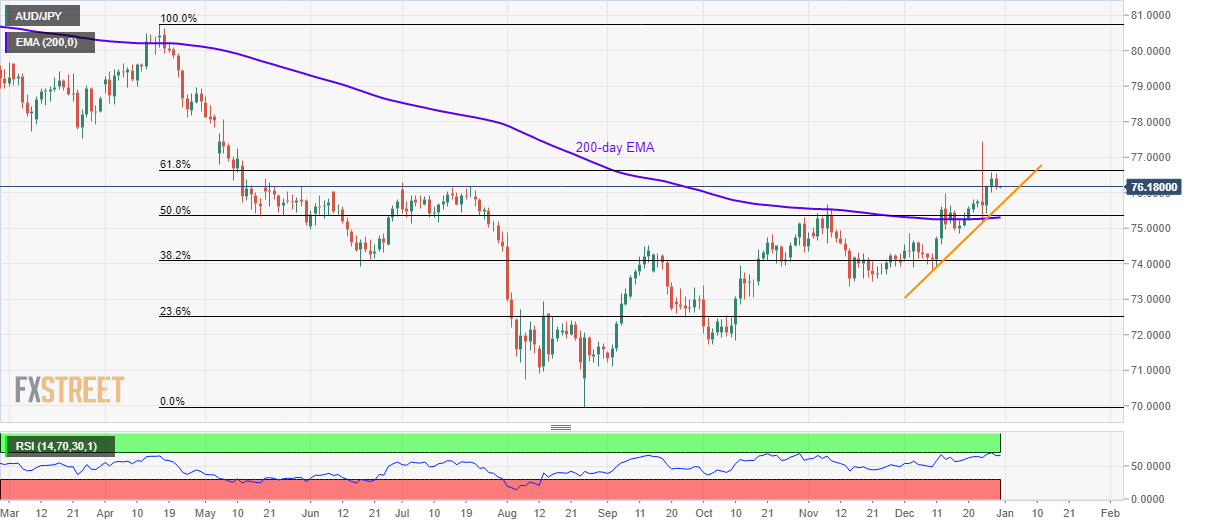
Overbought conditions of RSI and a failure to break 61.8% Fibonacci retracement of April-August declines seem to pave the way for the pair’s fresh downside. However, an upward sloping trend line since December 10, at 75.65 now, could challenge the bears.
Should there be a clear downside past-75.65, a confluence of 200-day EMA and 50% Fibonacci retracement around 75.30/35 will be the key level to watch as a break of which can drag AUD/JPY to December 18 low of 74.84.
Meanwhile, buyers will look for entry beyond 61.8% Fibonacci retracement level of 76.63.
In doing so, March month low of 77.54 will be on their radars. Though, 77.00 and May 10 top of 77.25 might offer intermediate halts during the run-up.
AUD/JPY daily chart
Trend: Pullback expected
