- AUD/JPY trades near 78.20 ahead of the Bank of Japan’s (BoJ) monetary policy meeting on early Friday.
- The quote recently confirmed inverse head and shoulders bullish formation by clearing 79.00 on hourly chart and is presently rising toward three-week-old descending trend-line, at 79.50.
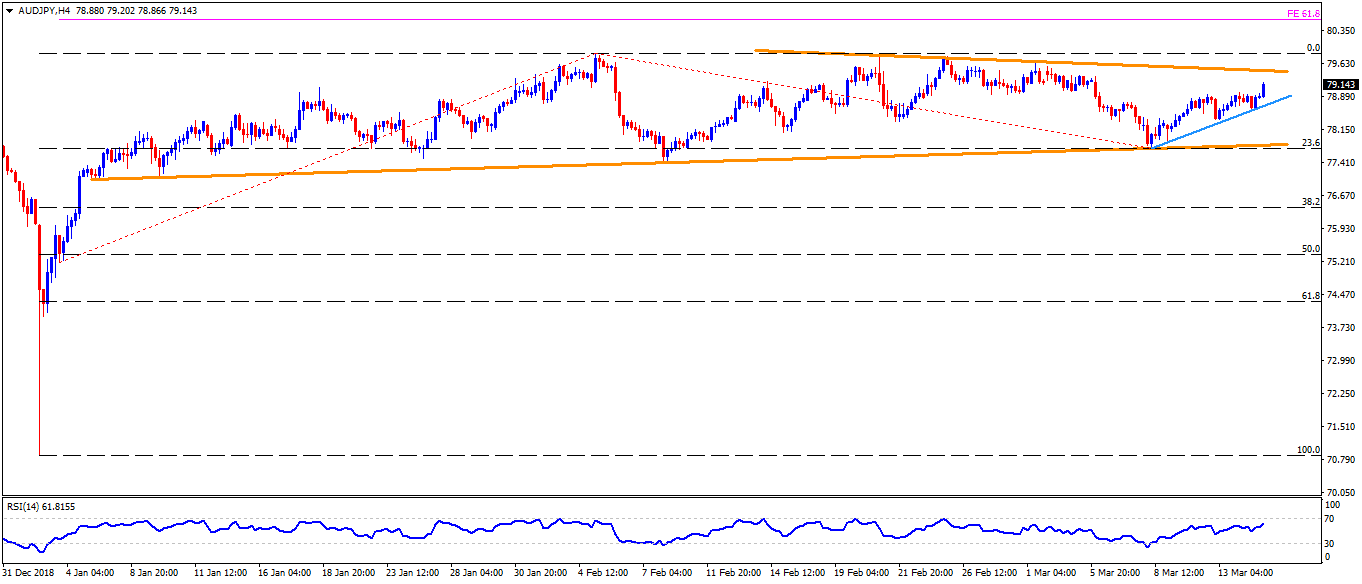
- Should prices manage to cross 79.50 immediate upside barrier, February month highs near 79.80/85 could act as buffers prior to highlighting 80.00 round-figure.
- Also, 61.8% Fibonacci expansion (FE) of its early January – March moves, around 80.60, may gain buyers’ attention post-80.00.
- Alternatively, pair’s dip beneath 79.00 can take rest on a weeklong upward sloping support-line at 78.60, a break of which may extend the pullback to 78.30 and 78.00.
- However, an ascending trend-line stretched since January 07 can challenge sellers around 77.70, if not then 77.00 can come back on the chart.
AUD/JPY 4-Hour chart
Additional important levels:
Overview:
Today Last Price: 79.16
Today Daily change: 25 pips
Today Daily change %: 0.32%
Today Daily Open: 78.91
Trends:
Daily SMA20: 78.97
Daily SMA50: 78.58
Daily SMA100: 79.71
Daily SMA200: 80.55
Levels:
Previous Daily High: 78.98
Previous Daily Low: 78.57
Previous Weekly High: 79.65
Previous Weekly Low: 77.72
Previous Monthly High: 79.85
Previous Monthly Low: 77.44
Daily Fibonacci 38.2%: 78.82
Daily Fibonacci 61.8%: 78.73
Daily Pivot Point S1: 78.66
Daily Pivot Point S2: 78.41
Daily Pivot Point S3: 78.25
Daily Pivot Point R1: 79.07
Daily Pivot Point R2: 79.23
Daily Pivot Point R3: 79.48
