While a break of a month-old ascending trend-line drags the AUD/JPY pair to the lowest in nearly two weeks, a horizontal-area connecting multiple highs marked since April 05 seems to limit the pair’s immediate downside around 79.65/60.
Adding further difficulties for sellers, 14-bar relative strength index (RSI) is near to oversold region and indicate pullback.
Should that happens, 79.80, 80.00 and 80.20 are likely nearby upside resistances that can question the quote’s pullback.
However, 80.45/50 and recent highs near 80.75 might offer tough upside barrier to the price rally past-80.20, a break of which can escalate the up-moves to 81.20 and 81.50 resistances.
If sellers refrain from respecting 79.60 support, 50% Fibonacci retracement of its upside since March 25 at 79.15 can offer an intermediate halt during the declines to 79.00.
Also, 78.50, 77.90 and 77.55 might entertain bears under 79.00.
AUD/JPY 4-Hour chart
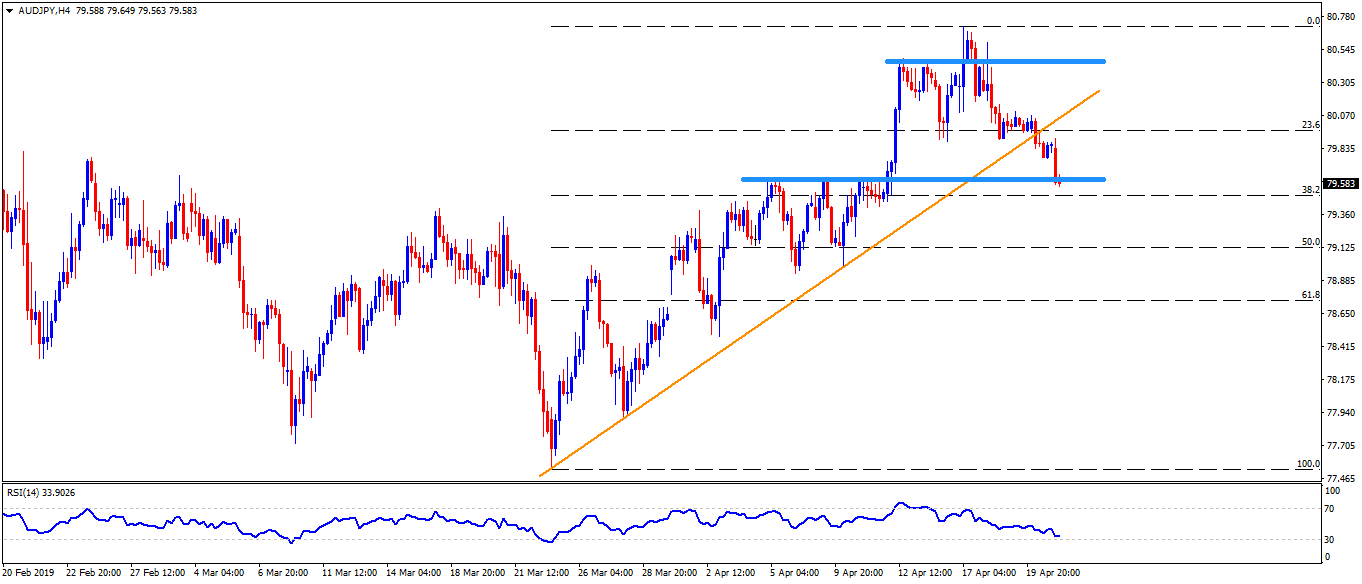
Trend: Pullback expected
