AUD/JPY daily chart
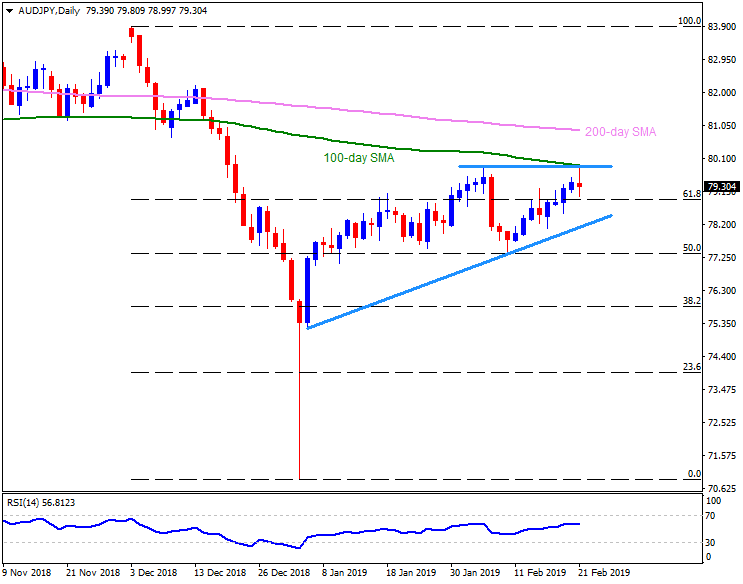
- AUD/JPY trades near 79.30 during early Thursday.
- The pair witnessed pullback from the 79.80-90 region, comprising 100-day simple moving average (SMA) and early month high.
- Buyers need to conquer the 79.90 in order to aim for 200-day SMA level of 80.90 and then 82.20 numbers.
- In case sellers manage to rule, 61.8% Fibonacci retracement of December to January decline, at 78.90 can become their immediate favorite.
- Though, an upward sloping trend-line at 78.10, may challenge the downturn, if not then 50% Fibonacci around 77.50 may mark its presence on the chart.
AUD/JPY 4-Hour chart
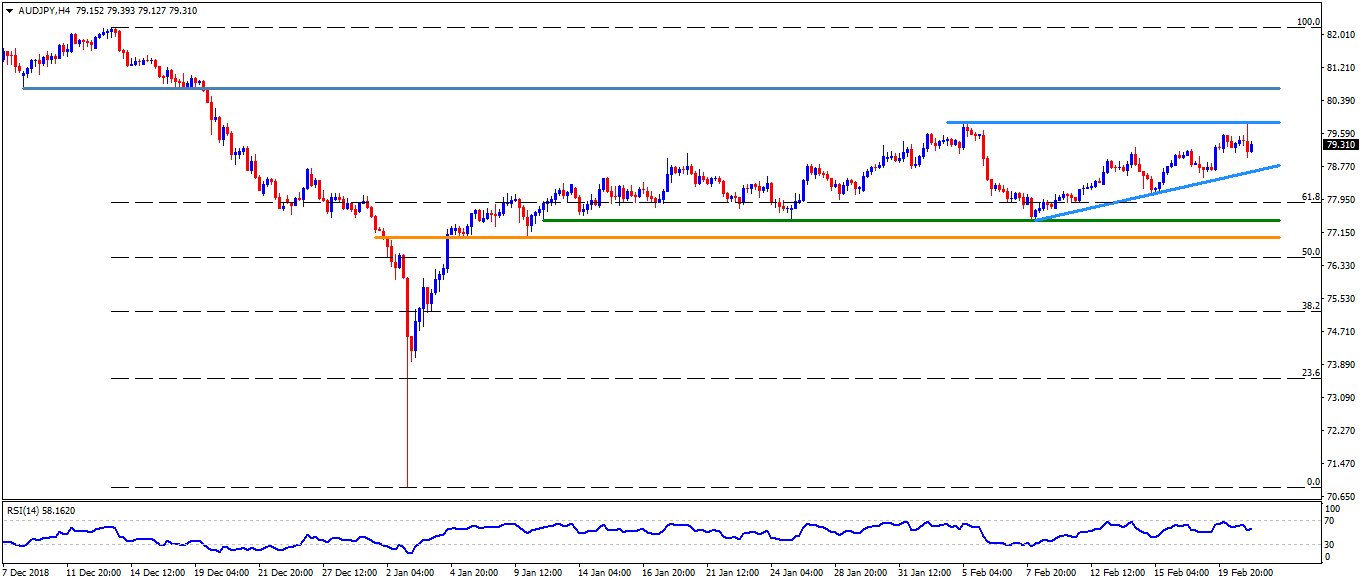
- On H4 chart, the 80.70 can offer an intermediate halt to the pair’s rise past-79.90 whereas 81.20 and 81.65 can please the bulls ahead of 82.20.
- Alternatively, adjacent support-line at 78.55 may offer nearby rest to the pair between 78.90 and 78.10 while 77.50 and 77.00 could flash on sellers radar afterward.
AUD/JPY hourly chart
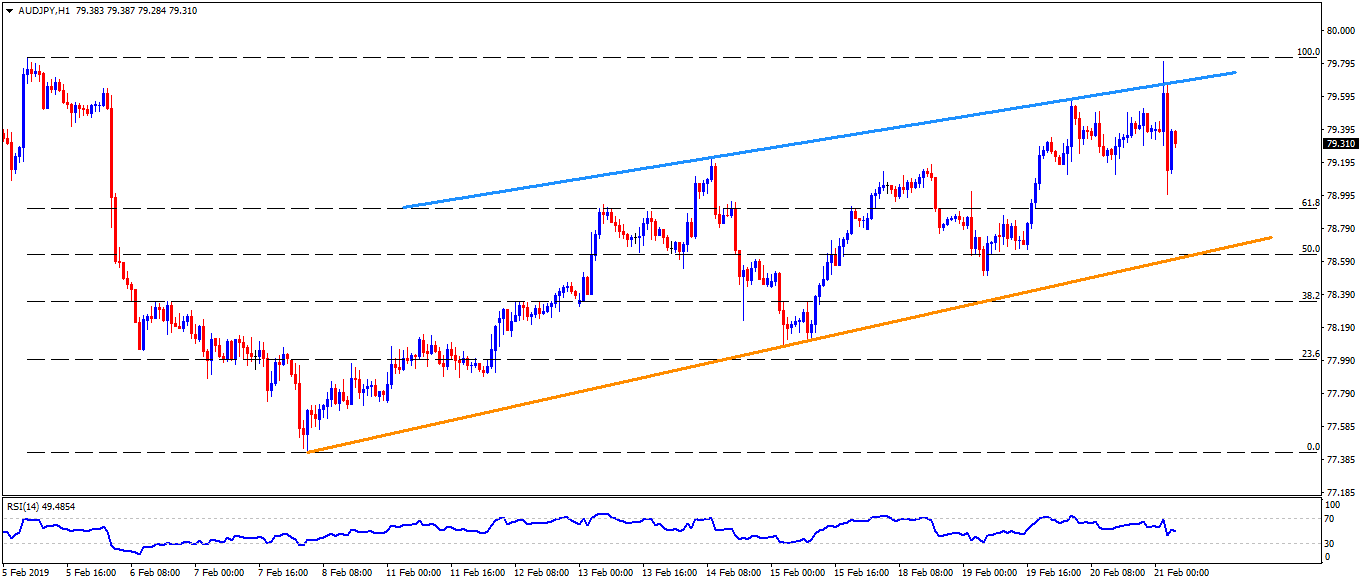
- An ascending trend-line connecting high marked on February 14 and 20, at 79.70, may become immediate resistance for the pair ahead of highlighting the 79.80-90 area.
- Meanwhile 61.8% Fibonacci retracement of its decline during the first week of the month, at 78.90 and an upward sloping trend-line, at 78.55, might act as adjacent supports for the pair.


