- AUD/JPY trades mostly unchanged below key resistance confluence.
- Back to back trend reversal candlestick formations show the complexity of traders.
- Bearish MACD, strong resistance on the upside favor the pair’s declines.
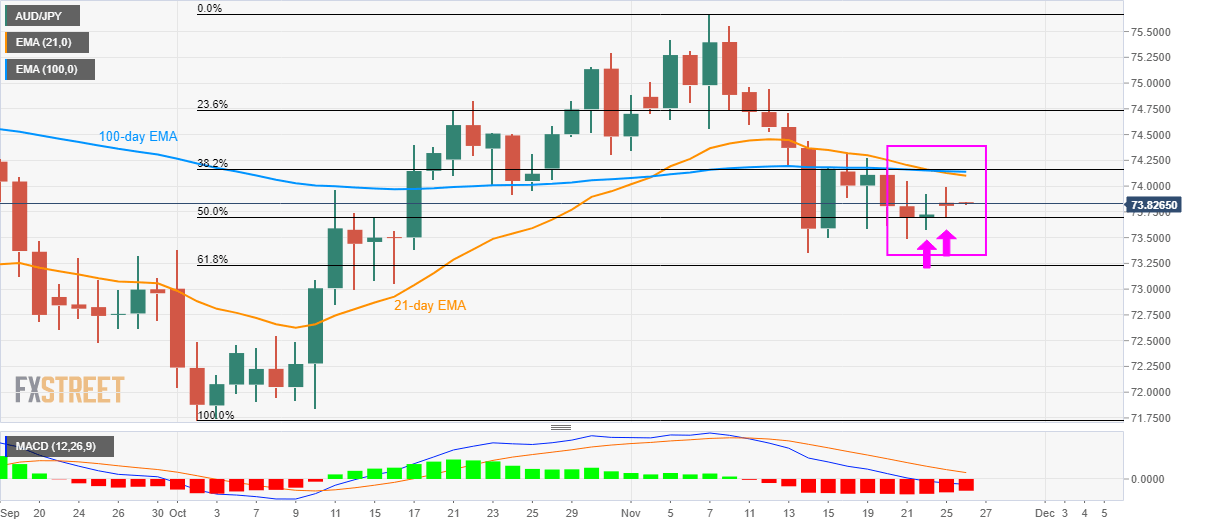
While showing traders’ indecision on the daily (D1) chart, AUD/JPY clings to 73.83 by the start of Tuesday’s Asian session. The quote recently registered consecutive trend reversal signaling candlestick formations.
In addition to the Doji candles of Friday and Monday, 74.10/15 resistance confluence including 21 and 100-day Exponential Moving Average (EMA) and 38.2% Fibonacci retracement of October-November upside also becomes the key to watch.
Though, bearish signals from 12-bar Moving Average Convergence and Divergence (MACD) signal pair’s further declines.
In doing so, a 50% Fibonacci retracement level of 73.70 and 61.8% Fibonacci retracement level of 73.23 could become initial rests before dragging the quote to 72.55 and the previous month bottom near 71.75.
Alternatively, an upside clearance of 74.15 could trigger fresh run-up towards November 07 low near 74.55 ahead of challenging 75.30 and the monthly top close to 75.70.
AUD/JPY daily chart
Trend: Sideways
