- The Australian Dollar (AUD) is taking the bids near 78.95 against the Japanese Yen (JPY) on early Thursday.
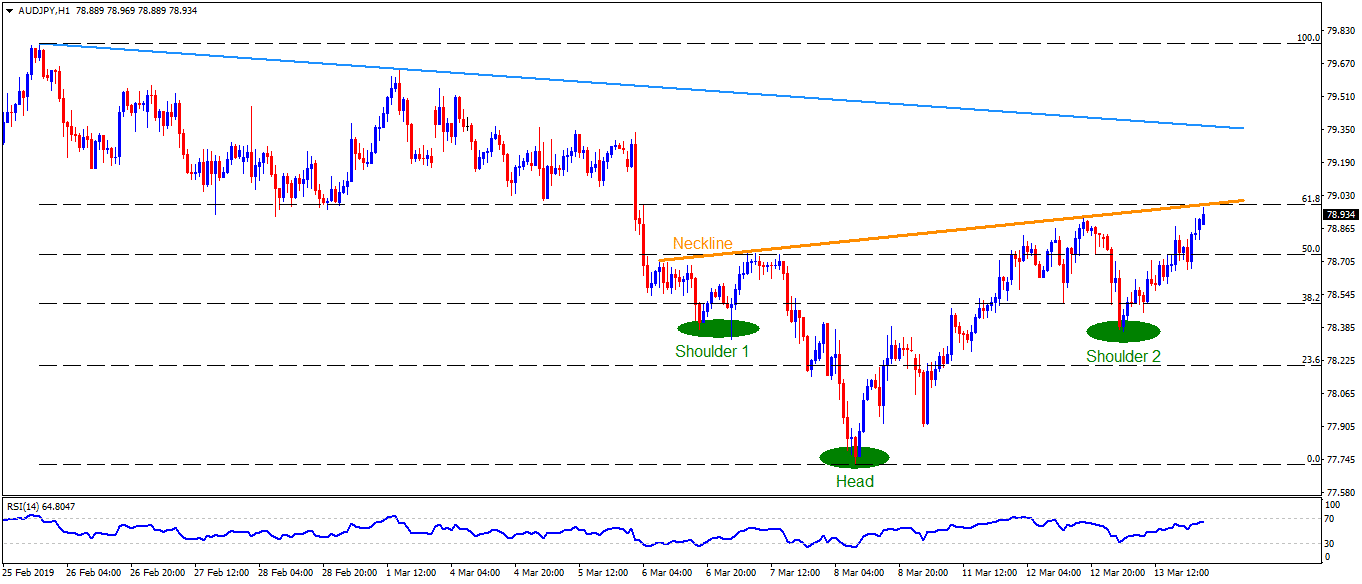
- AUD/JPY is forming an inverse head and shoulders pattern on the hourly chart that needs to be validated by a sustained break of 79.00 neckline figure.
- Should this happen, prices can rally theoretically towards $80.00 but a descending trend-line stretched since February 25, followed by the late last-month high, may challenge buyers around 79.40 and 79.80.
- In a case prices witness pullback, 50% Fibonacci retracement level near 78.70 and 78.30 are likely immediate supports to watch.
- During the pair’s additional weakness post-78.30, 78.00 and 77.70 may flash on bears’ radar.
AUD/JPY hourly chart
Additional important levels:
Overview:
Today Last Price: 78.94
Today Daily change: 8 pips
Today Daily change %: 0.10%
Today Daily Open: 78.86
Trends:
Daily SMA20: 78.94
Daily SMA50: 78.46
Daily SMA100: 79.72
Daily SMA200: 80.6
Levels:
Previous Daily High: 78.93
Previous Daily Low: 78.51
Previous Weekly High: 79.65
Previous Weekly Low: 77.72
Previous Monthly High: 79.85
Previous Monthly Low: 77.44
Daily Fibonacci 38.2%: 78.77
Daily Fibonacci 61.8%: 78.67
Daily Pivot Point S1: 78.6
Daily Pivot Point S2: 78.35
Daily Pivot Point S3: 78.18
Daily Pivot Point R1: 79.02
Daily Pivot Point R2: 79.19
Daily Pivot Point R3: 79.44
