- AUD/JPY looks for direction around key Exponential Moving Average (EMA).
- 61.8% Fibonacci retracement adds to the support.
- Bullish MACD favors pullback to September high.
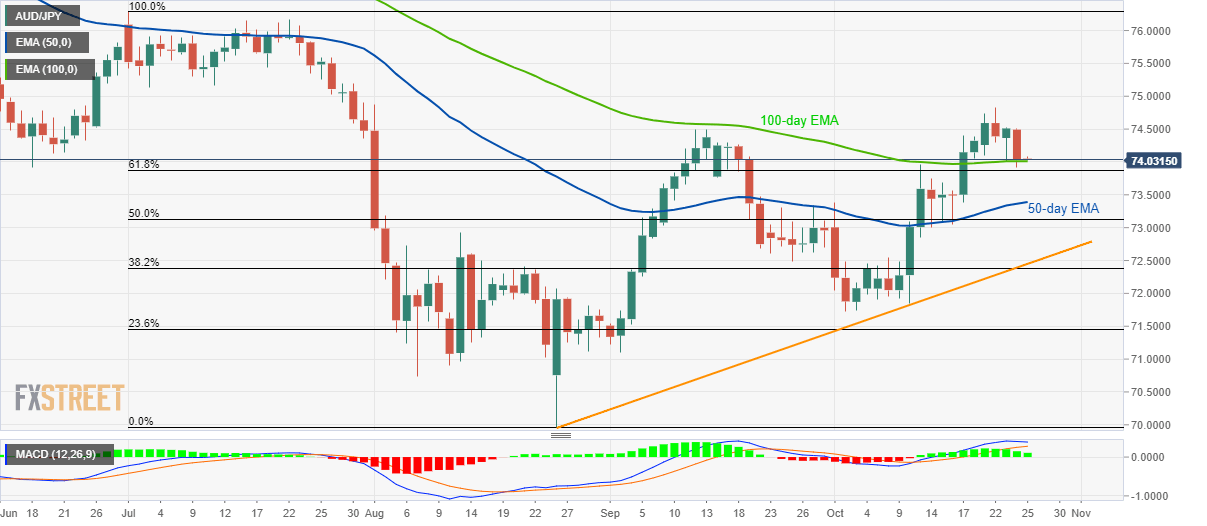
Despite marking the heaviest declines since the month-start, AUD/JPY stops around 100-day EMA while taking rounds to 74.00 amid the initial Asian session on Friday.
The pair clings to a 100-day EMA level of 74.00 while also nearing the 61.8% Fibonacci retracement of July-August downpour.
Not only nearness to key supports, bullish signals from 12-bar Moving Average Convergence and Divergence (MACD) also makes sense to anticipate pair’s bounce from present levels.
In doing so September high close of 74.50 and the monthly top surrounding 74.85 could question buyers targeting 75.00 and early-July lows near 75.15.
On the contrary, pair’s declines below 61.8% Fibonacci retracement level of 73.87 will highlight 73.40/35 area including 50-day EMA and October 01 high.
AUD/JPY daily chart
Trend: pullback expected
