- AUD/JPY stays inside one-week-old falling channel above the near-term key moving average.
- 72.40 become the key support-confluence to watch.
Despite successfully being above 4H 200MA, the AUD/JPY pair fails to overcome immediate falling channel as it trades near 72.80 during the early Asian session on Friday.
Not only 200-bar moving average on the four-hour chart (4H 200MA), at 72.62 now, but 72.40 support-confluence including lower-line of the channel and 61.8% Fibonacci retracement of current-month upside also challenges bears.
If prices slip below 72.40, late-August top surrounding 71.80 and monthly bottom close to 71.10 could gain market attention.
On the upside, 73.17/20 area comprising channel’s resistance-line and 38.2% Fibonacci retracement could keep challenging short-term buyers while a break of which could trigger fresh run-up to 73.85.
AUD/JPY 4-hour chart
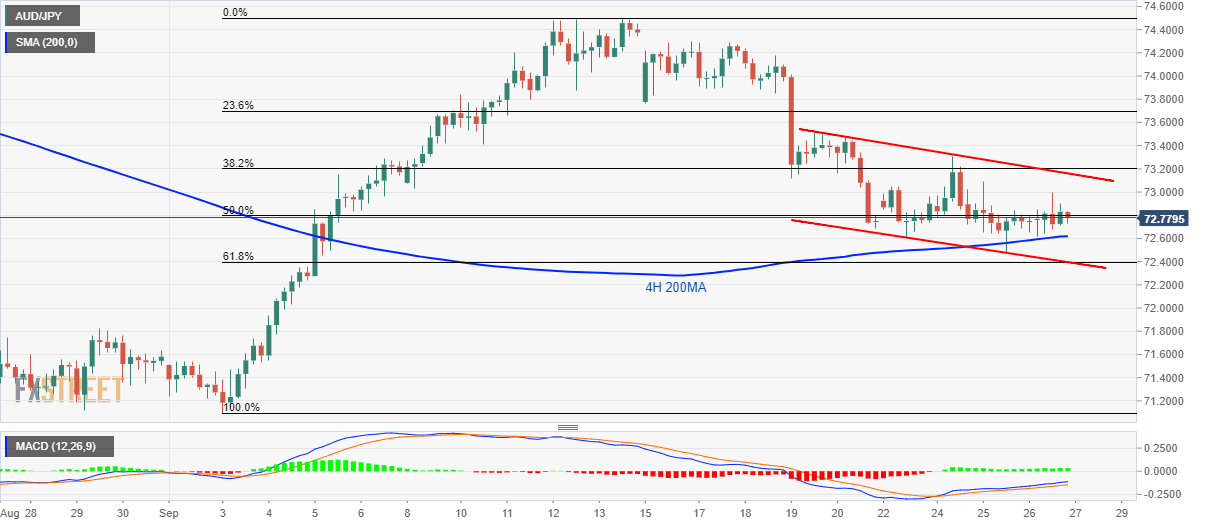
Trend: sideways
