- 21-HMA and 9-day long resistance-line limit the pair’s upside.
- RSI also not oversold, signaling additional declines.
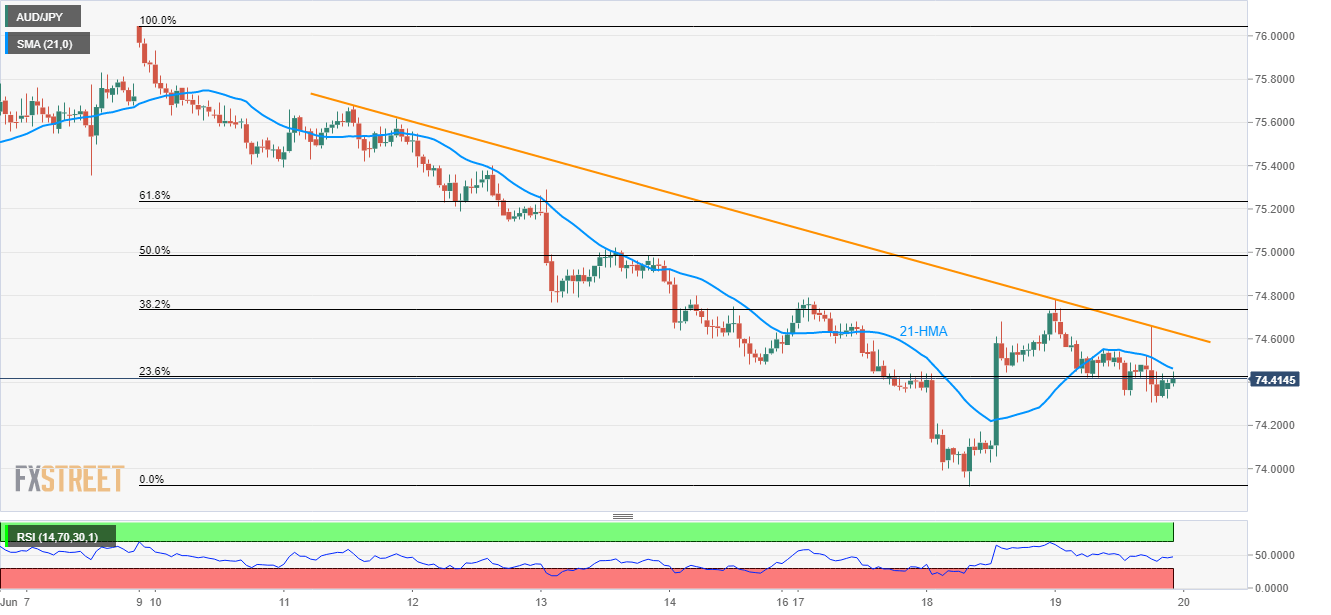
With the sustained trading below short-term descending trend-line, AUD/JPY seems on the back foot while trading near 74.40 during the early Asian session on Thursday.
Not only a downward sloping trend-line since June 11 but pair’s declines beneath 21-hour moving average (21-HMA) also portray the underlying weakness that can drag it to sub-74.00 area.
However, 74.30 and 74.18 are likely intermediate halt that might be availed during the downpour.
Should there be additional south-run under current month low of 73.92, 73.00 and the year 2016 bottom 72.40 could flash on sellers’ radar.
It is worth noting that 14-bar relative strength index (RSI) is also not in the oversold territory, favoring further declines.
Meanwhile, an uptick beyond 74.47 mark comprising 21-HMA needs validation from trend-line break, at 74.64 now, in order to aim for 74.80 and 75.00 numbers to the north.
Furthermore, 61.8% Fibonacci retracement of the latest slide at 75.24 and June 11 high near 75.70 could become buyers’ favorites during the extra rise.
AUD/JPY hourly chart
Trend: Bearish
