- AUD/JPY stands above 100-day EMA for the first time in nearly six months.
- Prices test highest in a month, below September top.
Despite successfully clearing 100-day Exponential Moving Average (EMA) for the first since late-April, AUD/JPY still trades below September month high while flashing 74.20 as a quote on early Asian morning session on Friday.
Unless providing a daily closing beyond 74.50, the pair is less likely to extend the latest recovery towards 50% Fibonacci retracement of April-August declines, around 75.35/40.
However, pair’s further rise will be challenged by a 200-day EMA level of 75.66, failure to do so can push bulls towards 76.20 and 61.8% Fibonacci retracement level, at 76.70.
Meanwhile, pair’s declines below 100-day EMA level of 73.97 can pull it back to 73.00 whereas 23.6% Fibonacci retracement near 72.50 and monthly bottom close to 71.70 will appear on sellers’ watch-list afterward.
AUD/JPY daily chart
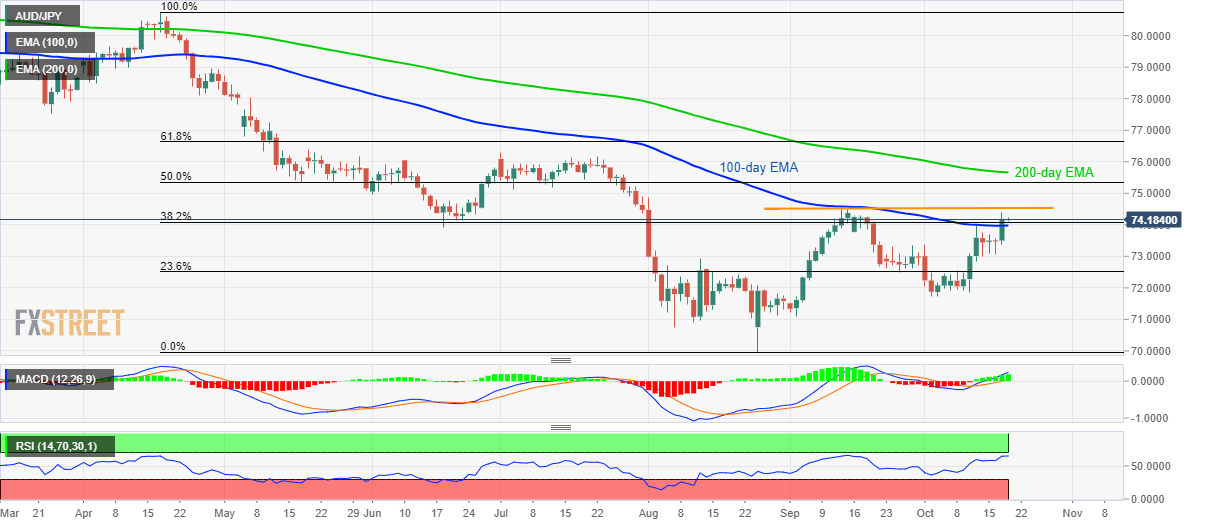
Trend: sideways
