- AUD/JPY trades near 78.90 during the early Asian session on Wednesday.
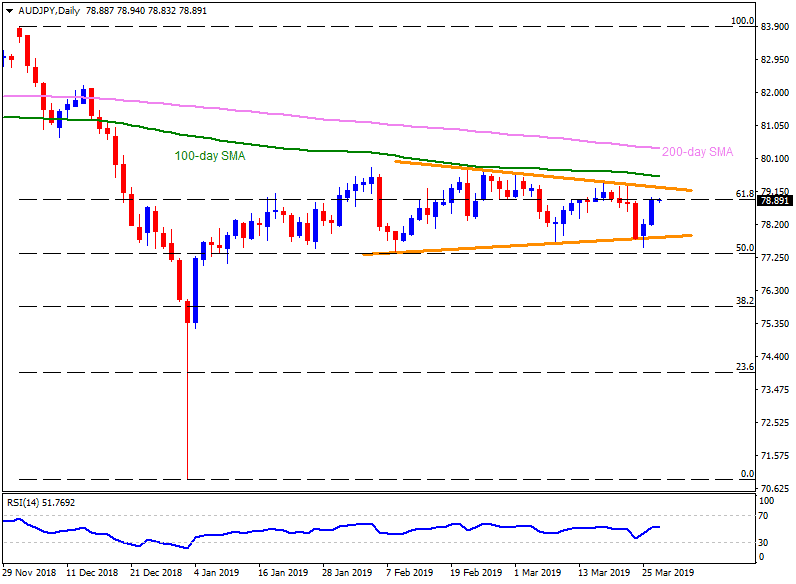
- The pair is close to 61.8% Fibonacci retracement of December 2018 to January 2019 downturn while also forms a symmetrical triangle pattern if connecting highs since February 21 and lows since February 08.
- Given the pair’s ability to cross the 61.8% Fibo around 79.00, triangle resistance at 79.30 and 100-day simple moving average (SMA) at 79.60 become crucial to watch.
- In a case prices rally beyond 79.60, 80.00 round-figure and 200-day SMA level of 80.40 could lure buyers.
- On the downside, 78.30 can act as immediate support ahead of shifting market attention to the 77.80 formation lower-line.
- Should prices slip under 77.80, February month low and 50% Fibonacci retracement could please sellers near 77.40/35.
- Additionally, 77.00, 76.00 and 75.40 are likely following numbers that could entertain bears past-77.35.
AUD/JPY daily chart