- AUD/NZD extends losses below 100/200-day EMA after Aussie Retail Sales.
- A five-week-old rising trend line on the Bears’ radar.
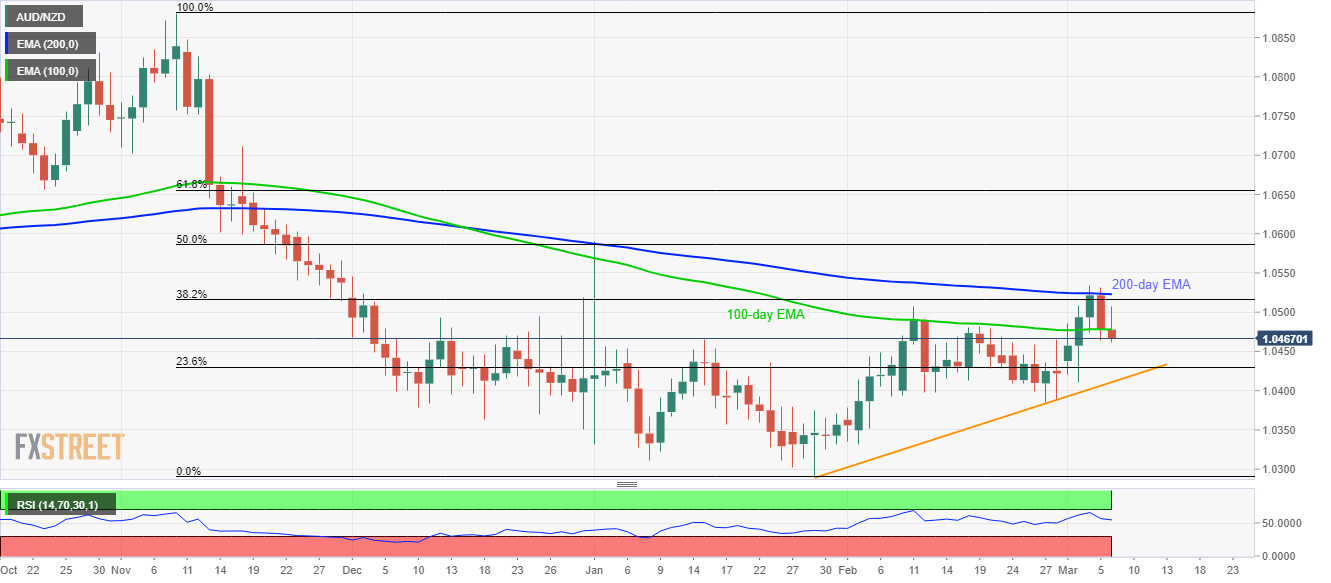
- 50% and 61.8% Fibonacci retracements can question buyers beyond 200-day EMA.
With the downbeat Aussie data helping to extend the previous day’s pullback from 200-day EMA, AUD/NZD slips below 100-day EMA while flashing 1.0468 amid the Asian session on Friday.
Read: Australia’s Retail Sales drop 0.3% in Jan, surprise negatively – AUD/USD off the highs
The pair now seems to decline towards 23.6% Fibonacci retracement of its fall from November 2019 to January 2020, at 1.0430.
However, an upward sloping trend line since January 29, currently around 1.0410, could question bears afterward.
On the upside, 100-day and 200-day EMA, respectively near 1.0480 and 1.0525, can question the buyers ahead of pushing them to 50% Fibonacci retracement near 1.0585.
Additionally, 61.8% Fibonacci retracement near 1.0655 and November 18, 2019, high of 1.0711 can lure the bulls beyond 1.0585.
AUD/NZD daily chart
Trend: Pullback expected
