- AUD/NZD bulls remain in play so long as they can get over the line.
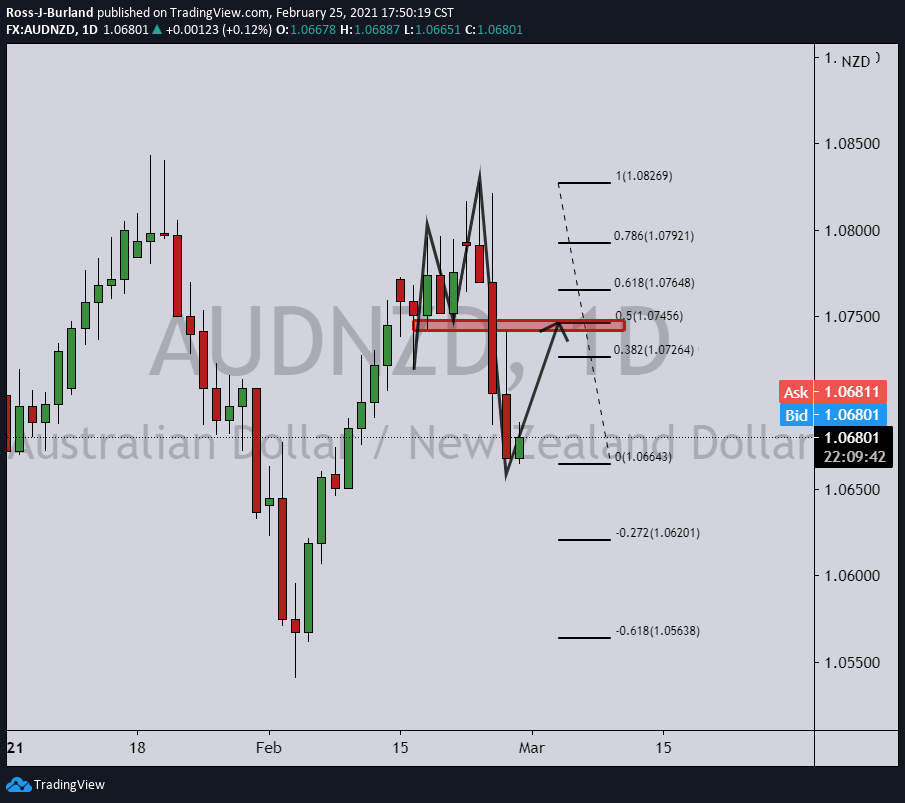
- The M-formation is a bullish chart pattern that would be expected to see a retest of old support.
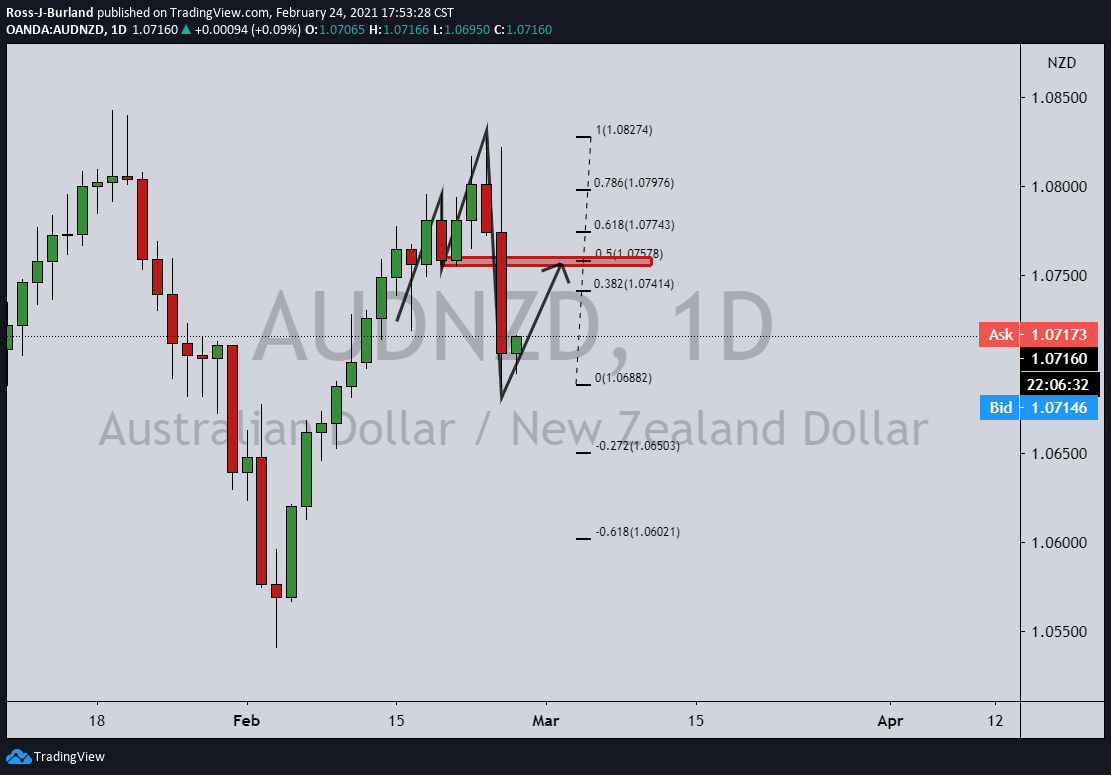
Further to the prior analysis, AUD/NZD Price Analysis: Bulls eye a 50% reversion confluence of old support, instead of an immediate correction, the price continued to deteriorate.
However, this offers a discount to the bulls in anticipation of a significant retracement.
Prior analysis, daily
Live market, daily chart
Hourly chart
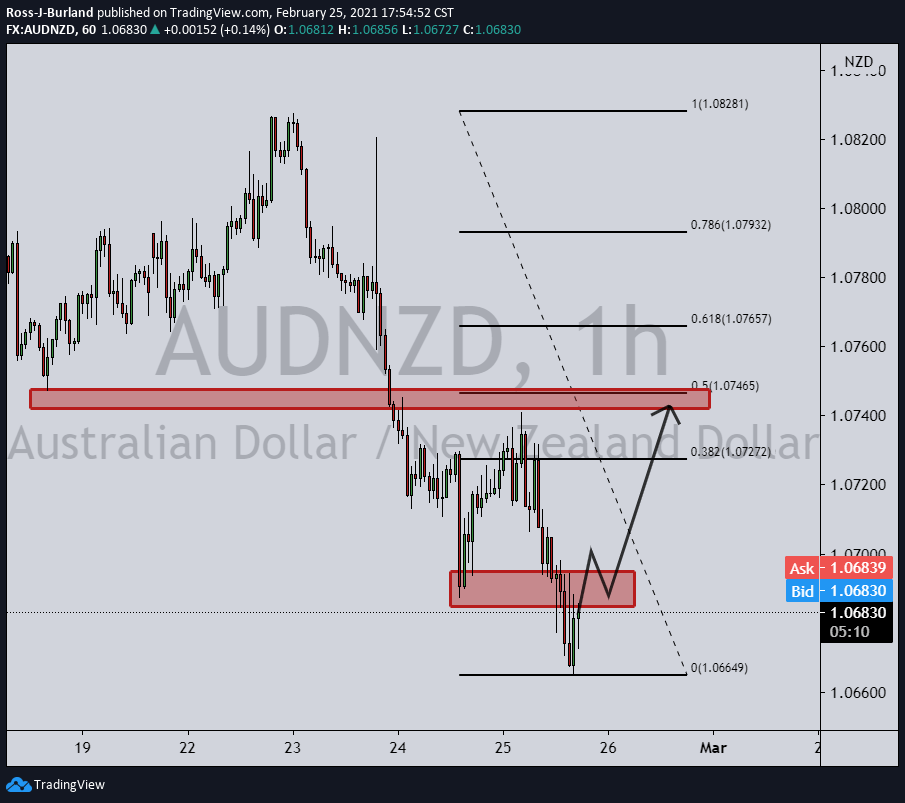
The market on the hourly chart is establishing support here and a break of resistance would be expected to equate to a significant correction to the formation’s neckline.
