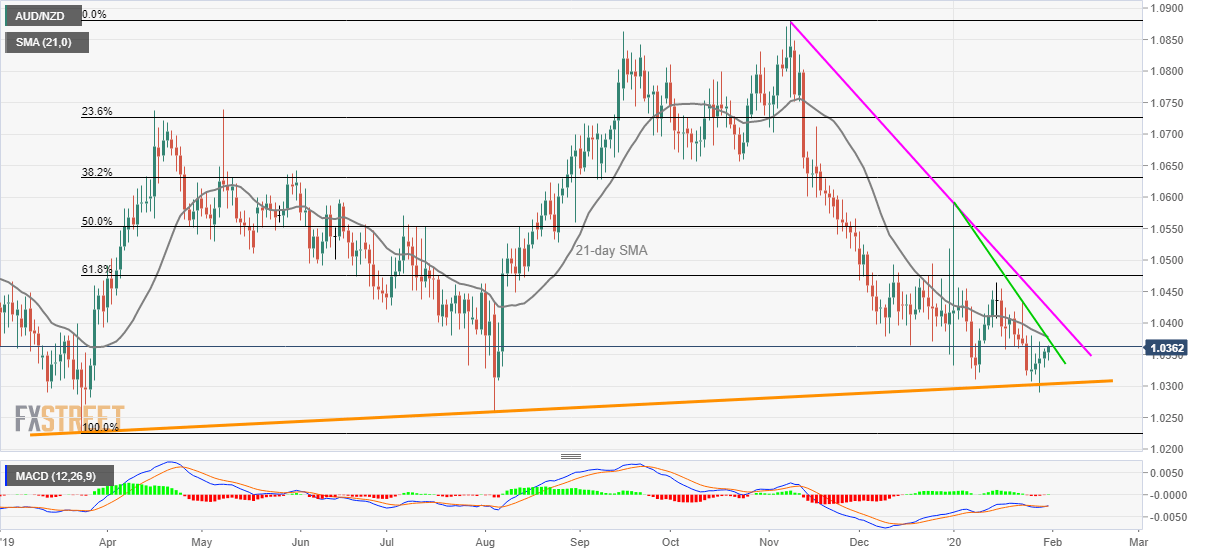
- AUD/NZD aims to confront 21-day SMA, monthly resistance line.
- An upward sloping trend line since March 2019 becomes the key support.
- A descending resistance line from early November 2019 also gains the bulls’ attention.
AUD/NZD remains on the front foot while flashing 1.0360 as a quote during the early Friday morning. While the pair’s latest up moves could be attributed to China’s PMI data, it’s recovery from the longer-term support line becomes important to note.
Read: Breaking: NBS Manufacturing PMI (Jan): 50 vs 50 expected (AUD rises slightly)
The pair currently heads to confront 21-day SMA and a monthly falling trend line around 1.0375/80 whereas a downward sloping resistance line since November 2019, at 1.0425 could question the buyers afterward.
In a case where the bulls manage to conquer 1.0425 on a daily closing basis, the quote becomes eligible to meet the 1.0500 mark.
Alternatively, a daily closing below the longer-term support line, at 1.0300 now, can quickly recall August 2019 low of 1.0259 and March 2019 bottom surrounding 1.0220 on the charts.
AUD/NZD daily chart
Trend: Further recovery expected
