- AUD/NZD rises to two-month high after Australia’s Q4 GDP surprised markets.
- 200-day SMA guards immediate upside, five-week-old support line acts as strong support.
AUD/NZD registers 0.13% gains to 1.0506 by the press time of Wednesday’s Asian session. The pair recently surged crossed 100-day SMA after Australia’s fourth quarter (Q4) GDP data beat expectations to the upside.
Read: Breaking: Australia Q4 GDP beats estimates and supports AUD higher
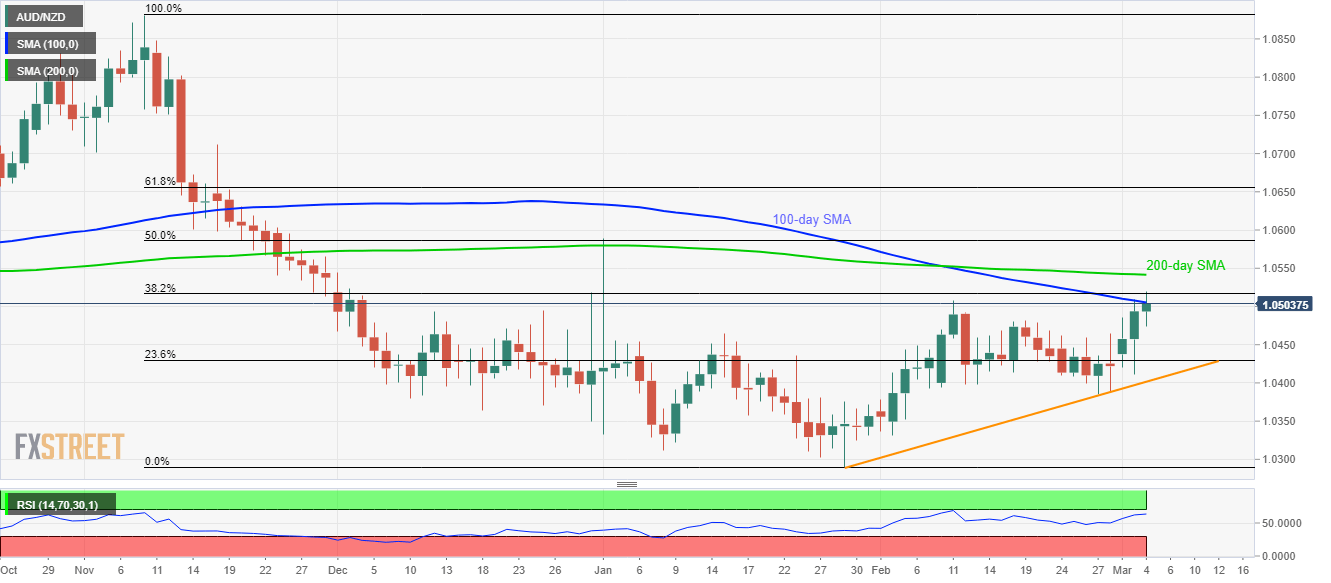
Even so, the pair’s further buying may wait for a sustained break of 38.2% Fibonacci retracement of its November 2019 to January 2020 fall, at 1.0517.
Following that, the 200-day SMA level near 1.0540 becomes the key upside barrier holding gates for 1.0600 and 61.8% Fibonacci retracement level near 1.0660.
On the downside, 1.0460 and 23.6% Fibonacci retracement near 1.0430 act as near-term key supports ahead of an upward sloping trend line since January 29, 2020, currently around 1.0400.
In a case where the pair drops below 1.0400, 1.0300 and the yearly low near 1.0290 are likely to return to the charts.
AUD/NZD daily chart
Trend: Bullish
