- AUD/NZD seesaws near a two-week low.
- RSI conditions join the key Fibonacci retracement level to raise questions for the bears.
- A 12-day-old falling resistance line, 23.6% Fibonacci retracement limit immediate upside.
AUD/NZD extends the latest declines to 1.0400, the lowest since February 13, 2019, during the early Asian session on Thursday. New Zealand’s January month trade data could be considered as the latest fundamental catalyst for the pair.
Read: NZD/USD refreshes four-month low under 0.6300 after New Zealand Trade Balance
Even so, the pair is yet to provide a sustained break of 50.0% Fibonacci retracement of its run-up from January 29 to February 11, around 1.0399., which holds the key to further declines targeting 61.8% Fibonacci retracement level of 1.0373.
In a case where the AUD/NZD prices keep declining below 1.0370, 1.0325 and 1.0290 are likely levels to lure the bears.
Though, weak RSI conditions and the strength of the 50% Fibonacci retracement level seem to favor the pair’s pullback. In doing so, 1.0430 can act as the immediate resistance to watch whereas a confluence of short-term falling trend line and 23.6% Fibonacci retracement near 1.0455/60 can question the buyers afterward.
If at all the quote manages to cross 1.0460, it becomes capable of piercing 1.0500 mark.
AUD/NZD four-hour chart
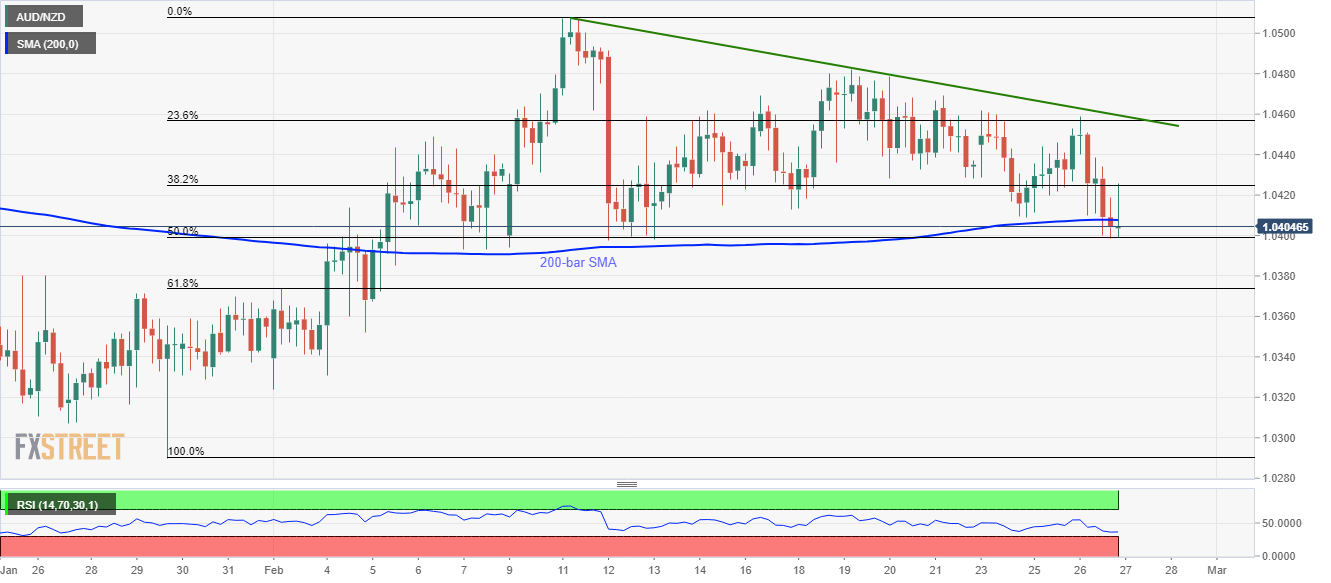
Trend: Pullback expected
