- AUD/NZD bounces off 61.8% Fibonacci retracement after mixed NZ data.
- A downside break could recall March-end, early-April lows surrounding 1.0400.
Given the New Zealand’s ANZ data flashing mixed results, the AUD/NZD pair took a U-turn from 61.8% Fibonacci retracement of its March-April upside to trade near 1.0467 amid Asian session on Thursday.
New Zealand’s June month ANZ Activity Outlook grew past-7.8% forecast to 8.0% but Business Confidence dropped below -22.7 market consensus to -38.1.
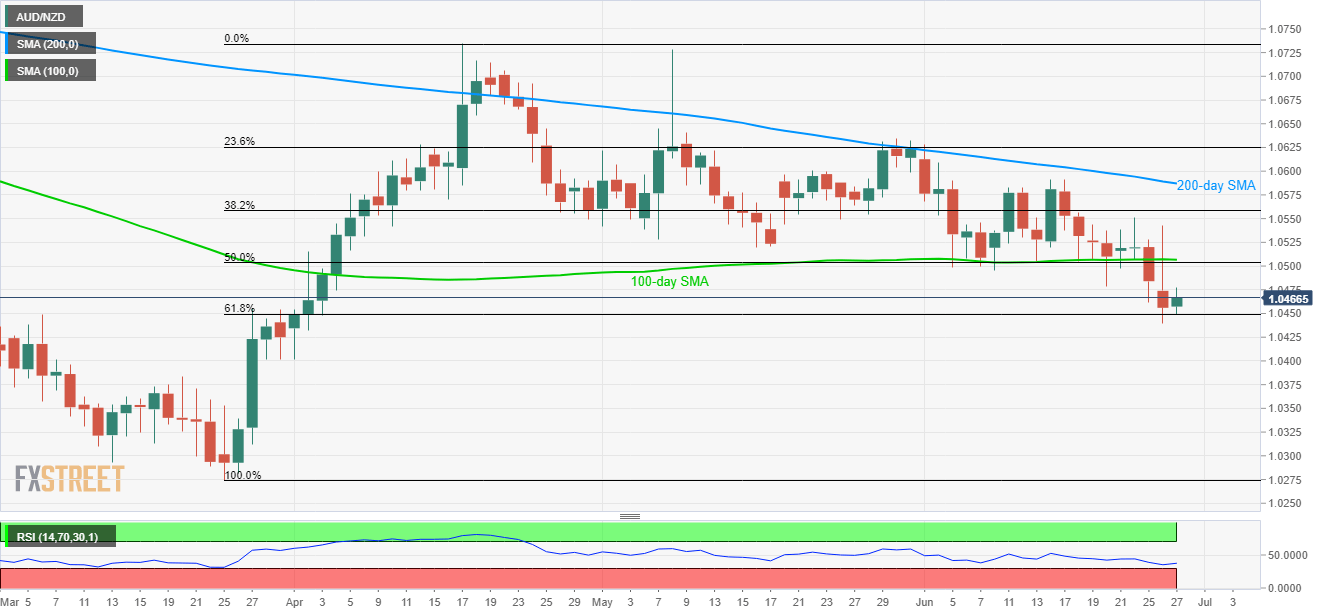
While the pullback from the key support and the near oversold conditions of 14-day relative strength index (RSI) indicates the pair’s further increase, 50% Fibonacci retracement and 100-day simple moving average (SMA) can question the rise near 1.0500/1.0510.
If bulls manage to clear 1.0510 upside barrier, 38.2% Fibonacci retracement near 1.0560 and 200-day SMA level of 1.0587 may flash on their radar.
On the flipside, pair’s decline below 61.8% Fibonacci retracement level of 1.0449 can quickly fetch the quote to March-end, early-April bottoms around 1.0400.
During the pair’s additional weakness past-1.0400, March 20 high of 1.0383 and the same month’s low of 1.0275 can please the sellers.
AUD/NZD daily chart
Trend: Pullback expected
