- AUD/USD trades 0.36% higher on Monday as the rally continues.
- There is some resistance just over the horizon at 0.7043.
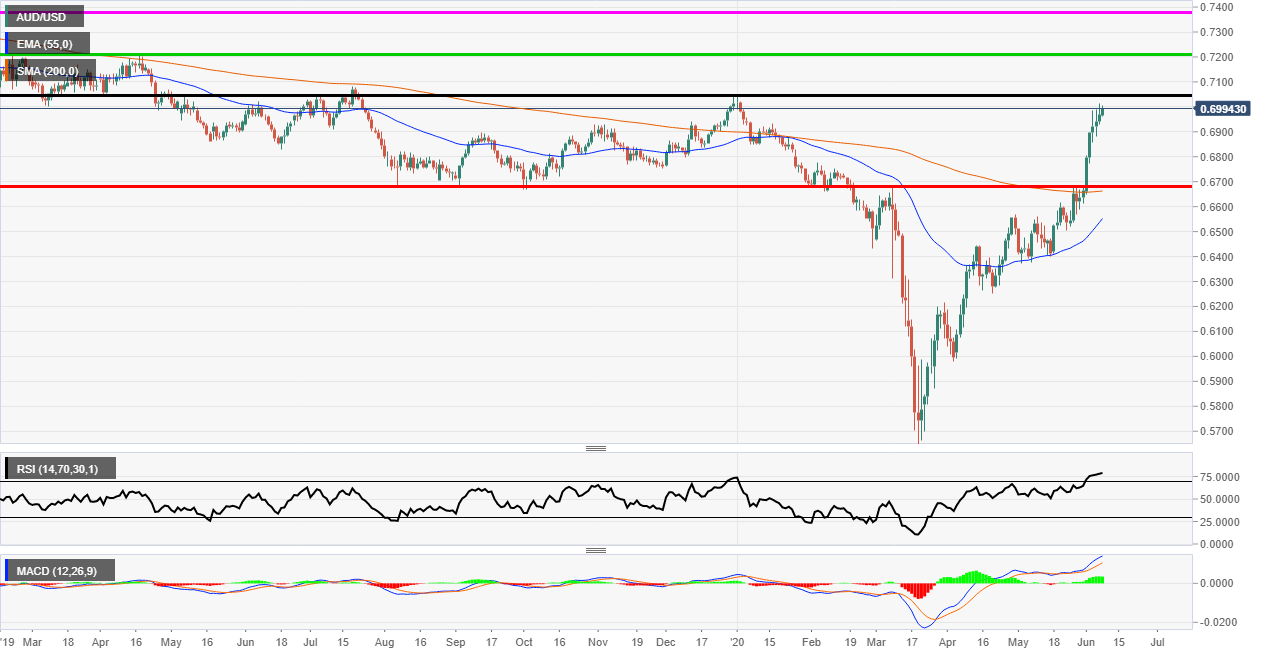
AUD/USD daily chart
AUD/USD trades just over 27% higher since hitting a low on 19th March which is quite some rally. The psychological 0.70 mark has been causing some issues and may provide a reason for a much-needed pullback but there are some resistance zones above current levels.
The black horizontal line is from the wave high on 31st December 2019. It is amazing to think that we are so close to the level and the price might make a yearly high. The commodities currencies have been doing very well in recent weeks as USD/CAD has also struggled making CAD one of the outperformers alongside AUD and NZD.
The MACD is showing a large separation but it is not as large as the separation seen on the downtrend when the price was heading to the lows. The Relative Strength Index indicator is in an oversold area and it could indicate a retracement is imminent.
AUD/USD 1-hour chart
The hourly chart is showing up some signs of exhaustion. The Relative Strength Index indicator is showing a massive divergence marked by the orange trendline. This is when the price makes higher highs but the indicator makes lower highs. This can tell us that the price momentum is decreasing. The MACD histogram has also been in the red for a while. There is also an ascending triangle pattern and if this breaks to the downside it could indicate a retracement is on the cards.
-637272334001433573.png)
