- AUD/USD marks corrective pullback from one week low marked the previous day.
- RSI conditions suggest further recovery moves towards the key SMA.
- 61.8% Fibonacci retracement adds to the downside support.
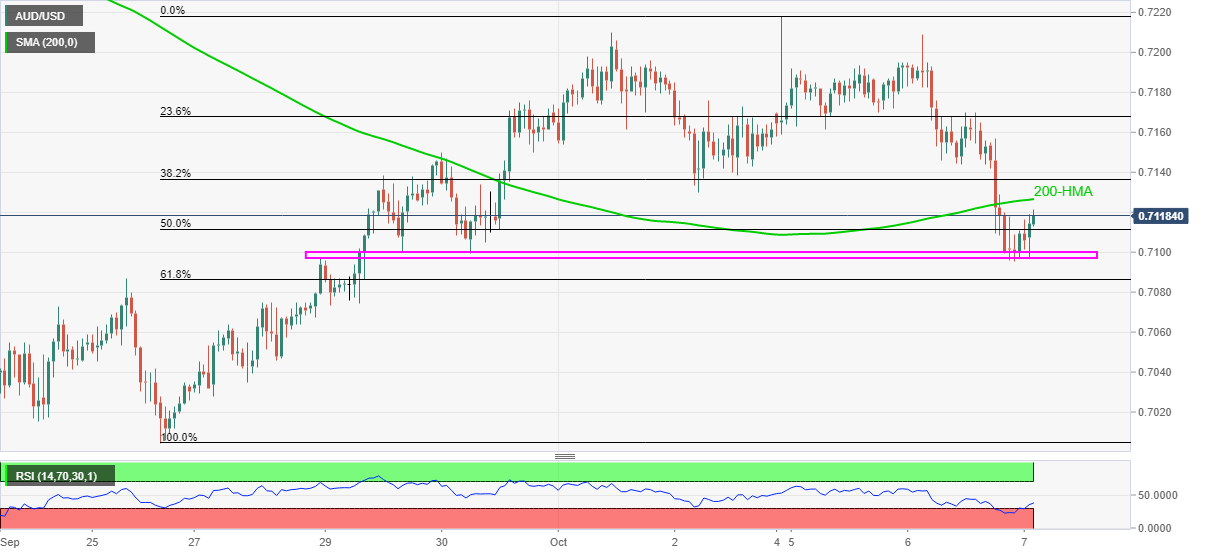
AUD/USD regains 0.7100, currently around 0.7120, during the early Wednesday. The pair dropped to the lowest since September 29 the previous day but horizontal support comprising levels marked late last month restricted any further declines. Also supporting the bounce could be the oversold RSI conditions.
The anticipated normalization of the RSI conditions may push AUD/USD prices further towards the key 200-HMA level of 0.7125. Though, Friday’s low near 0.7130 can play a role in the key resistance.
If at all the quote manages to cross 0.7130, the 0.7200 round-figure and the monthly top near 0.7220 will lure the bulls.
Meanwhile, the 0.7100-7095 area will join the 61.8% Fibonacci retracement level of September 25 to October 02 upside, near 0.7085, to restrict short-term AUD/USD declines.
Should there be a further weakness past-0.7085, sellers may take rests upon 0.7030 and 0.7015 before targeting the 0.7000 psychological magnet.
AUD/USD hourly chart
Trend: Pullback expected
