- AUD/USD bears take up the lead as price stalls in a strong monthly bullish trend.
- The weekly and daily chart offer a compelling bearish bias.
AUD/USD is on the backfoot and a Fibonacci retracement to the 38.2% aligns with prior structure. The following is a top-down analysis which illustrates the bearish bias.
Monthly chart
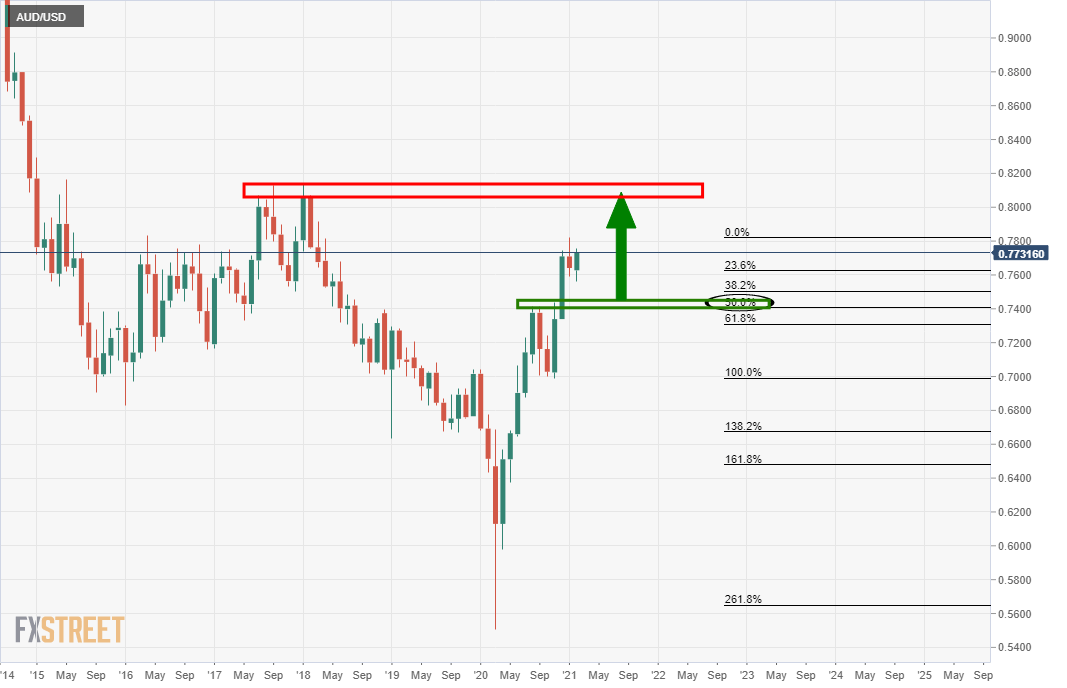
From a monthly perspective, the price is stalling following two strong consecutive months of a bullish trending market. While there is still an upside bias, the prospects for a meaningful correction are seen clearer from the lower time frames.
Weekly chart
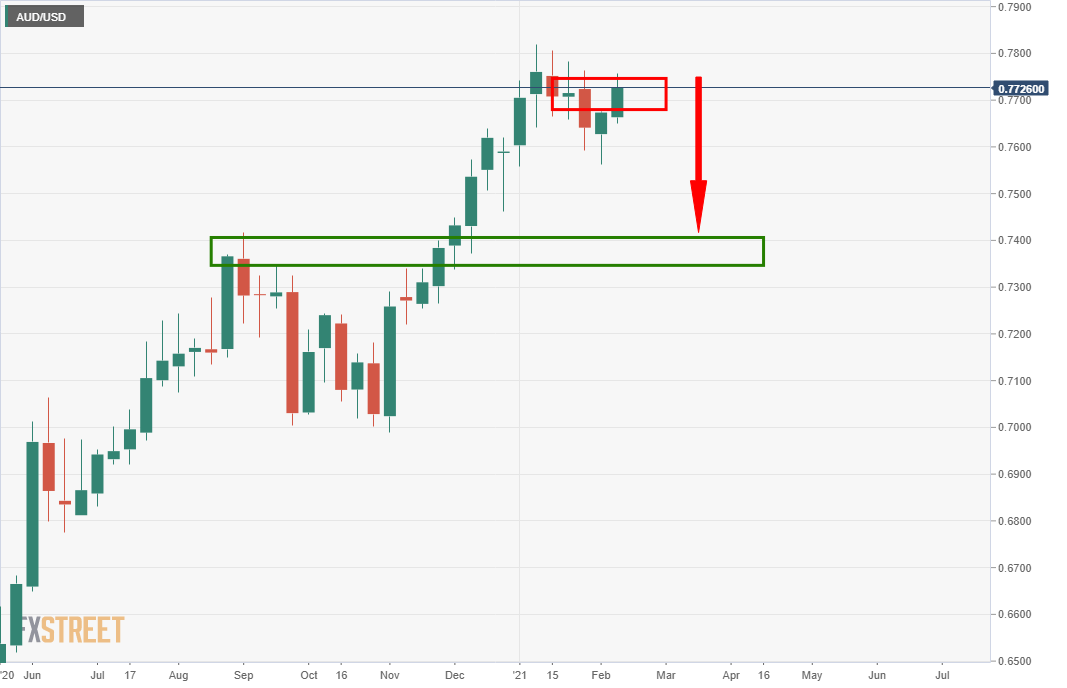
The price is testing the resistance which would be expected to hold and lead to a subsequent move to the downside.
Daily chart
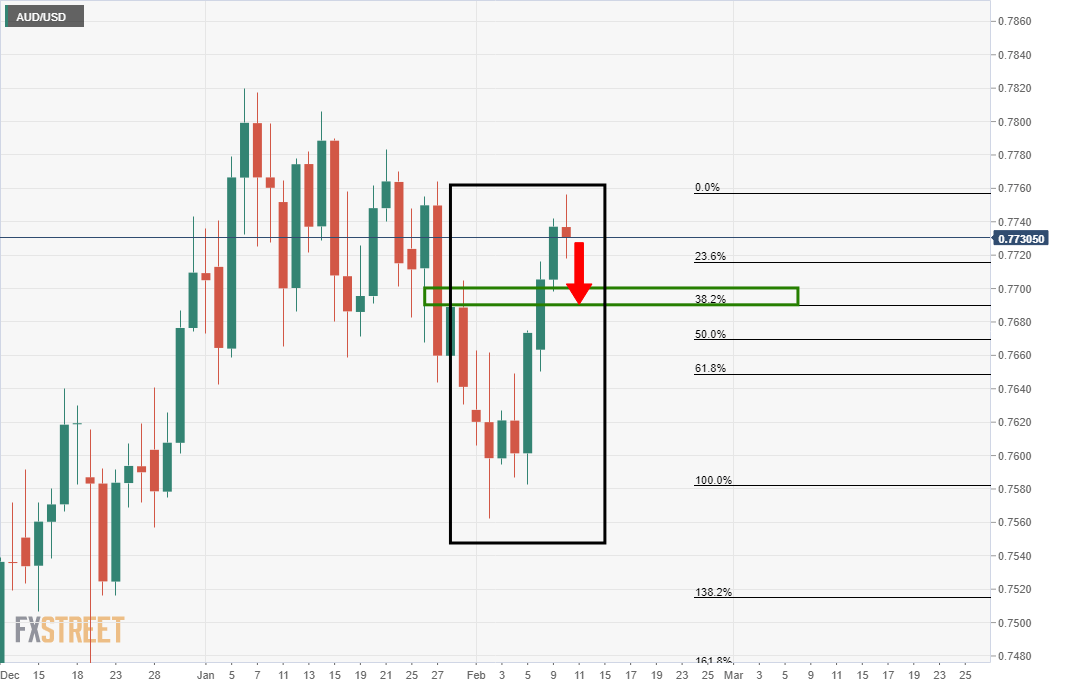
The doji on the daily chart could be the trigger that sets off a move to the prior structure which aligns with a 38.2% Fibonacci retracement level.
