- AUD/USD’s path of least resistance is to the upside.
- The spot charts symmetrical triangle breakout on hourly sticks.
- A test of 0.70 likely, as focus shifts to US Services PMI, RBA.
AUD/USD broke the recent 50-pips range trade to the upside on Monday, helped by the risk-on market mood, as the global stimulus hopes overshadowed the coronavirus and Australian-Sino concerns.
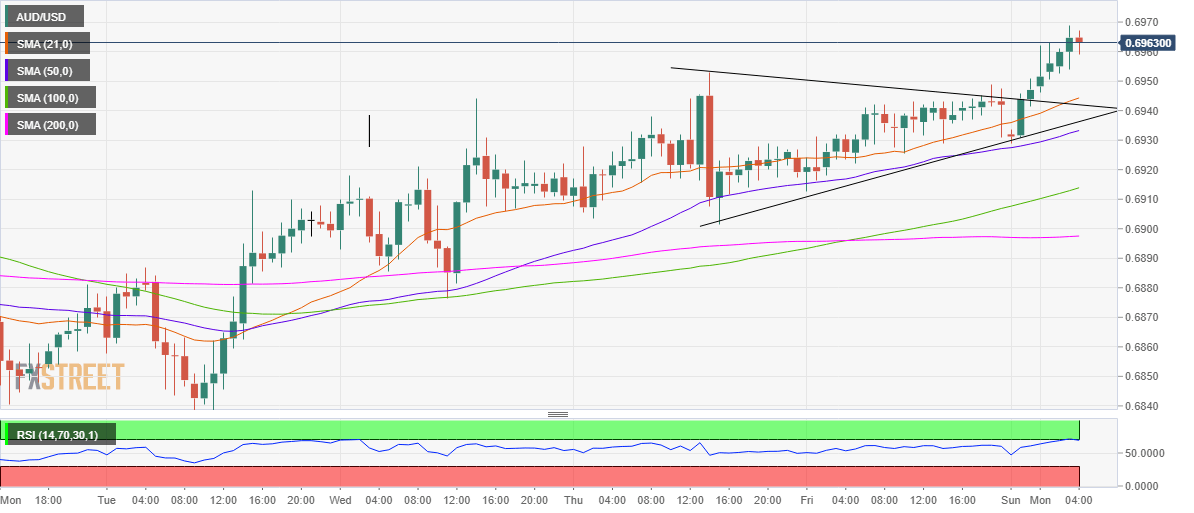
Looking at the hourly chart, the spot has confirmed a symmetrical triangle breakout in early Asia, having pierced through the falling trendline (pattern) resistance at 0.6943.
The bulls now aim for the pattern target of 0.6995 in the week ahead, in absence of healthy upside barriers.
On the flip side, the 0.6944/43 level will limit any pullbacks, as the falling trendline resistance-turned-support and bullish 21-hourly Simple Moving Average (HMA) coincide at that level.
Further south, the confluence of the 50-HMA and the rising trendline (pattern) support at 0.6936/33 will be tested.
A break below the latter will trigger a fresh decline towards the upward sloping 100-HMA at 0.6914 while the horizontal 200-HMA at 0.6897 will be the level to beat for the bears.
AUD/USD hourly chart
AUD/USD additional levels
