- RBA’s dovish surprise prompted some fresh selling around AUD/USD on Tuesday.
- A sudden pickup in the USD demand further contributed to the intraday downfall.
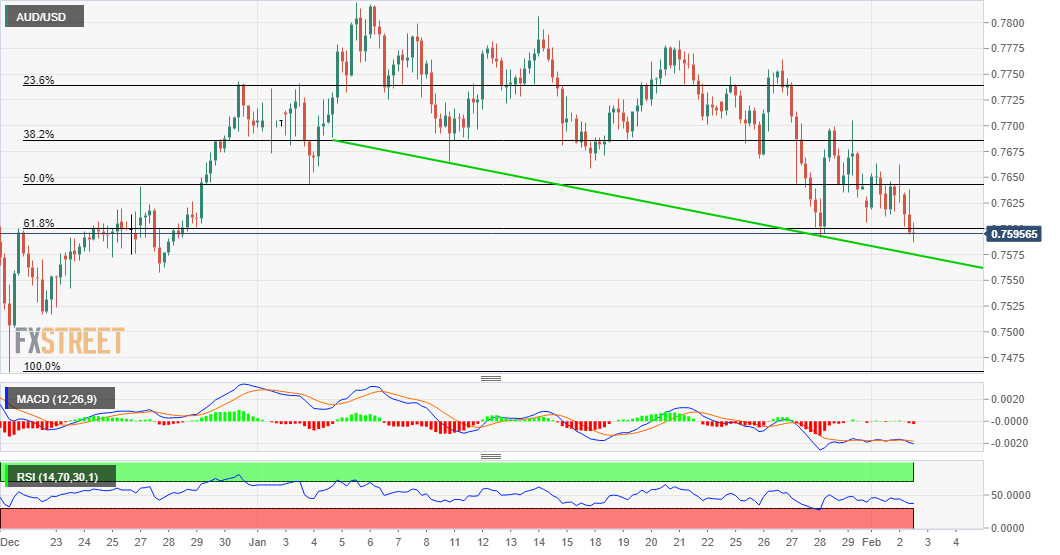
- A sustained break below the 0.7570-65 region will set the stage for further decline.
The AUD/USD pair extended the post-RBA retracement slide from the 0.7660 area and dropped to its lowest level since late December during the mid-European session.
A goodish pickup in the US Treasury bond yields helped revive the US dollar demand, which, in turn, was seen as a key factor dragging the pair lower. Bears are now looking to extend the downfall further below the 0.7600 mark, representing the 61.8% Fibonacci level of the 0.7522-0.7820 strong move up.
Meanwhile, technical indicators on 4-hourly/daily charts have been gaining negative traction and support prospects for further weakness. That said, any subsequent fall is likely to find decent support near a four-week-old descending trend-line, currently around the 0.7570-65 region.
Some follow-through selling will be seen as a fresh trigger for bearish traders and set the stage for an extension of the recent corrective slide from multi-year tops. The AUD/USD pair might then accelerate the downward trajectory and aim towards challenging the key 0.7500 psychological mark.
On the flip side, the 0.7655-60 region now seems to have emerged as immediate strong resistance. A sustained move beyond the mentioned barrier is needed to negate any near-term bearish bias. This, in turn, might push the AUD/USD pair through the 0.7700 mark, towards the 0.7750 resistance.
AUD/USD 4-hourly chart
Technical levels to watch
