- AUD/USD eases from one-week top, stays mildly bid.
- Overbought RSI, bearish chart pattern keep stop buyers.
- Sellers need clear break of 0.7750 for fresh entry.
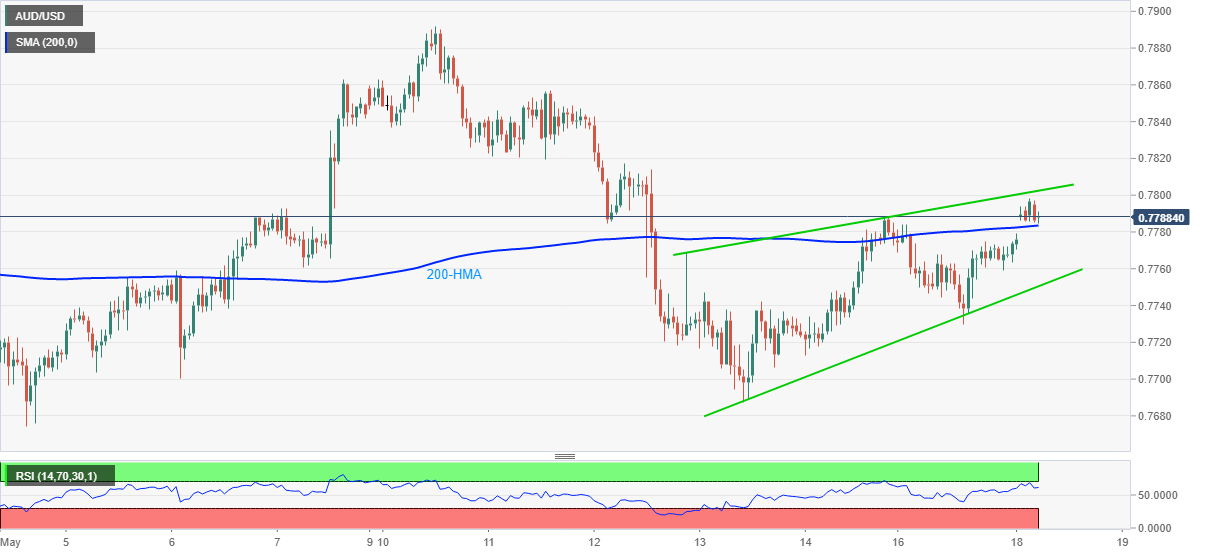
AUD/USD fades the post-RBA minutes run-up while retesting the 200-HMA level near 0.7785, up 0.31% intraday, ahead of Tuesday’s European session. In doing so, the Aussie pair justifies the RSI line’s pullback from the overbought area inside a short-term rising wedge bearish formation.
That said, the pair’s further weakness needs a downside break of 0.7785 before directing AUD/USD sellers towards the wedge’s support line, around 0.7750.
Should the AUD/USD prices drop below 0.7750, the 0.7700 threshold can offer an intermediate halt before directing the quote towards the monthly low near 0.7675.
Alternatively, an upside clearance of 0.7805 negates the bearish chart pattern. However, multiple tops near 0.7820 and 0.7860 could test AUD/USD bulls afterward.
In a case where the Aussie pair jumps above 0.7860, the monthly top near 0.7895 and the 0.7900 should return to the charts.
AUD/USD hourly chart
Trend: Pullback expected
