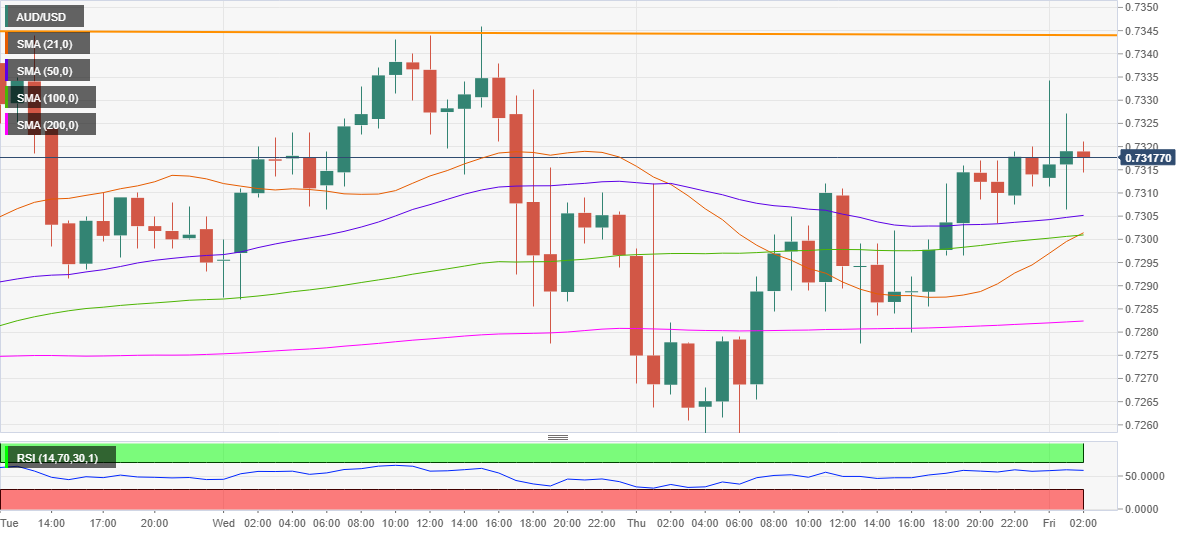
- AUD/USD looks to extend the bounce above 0.7300.
- Bullish SMA crossover on the hourly chart suggests more gains.
- Hourly RSI turned south but remains in the bullish region.
AUD/USD is consolidating the overnight bounce above 0.7300, thanks to the sell-off in the US dollar, as concerns on the US economic recovery returned after the initial jobless claims remained at persistently high levels.
From a technical perspective, the price managed to bounce off the critical horizontal 200-Simple Moving Average on the hourly chart (HMA) at 0.7280. From there, the rebound gathered steam, as the aussie recaptured all the major averages on the said time frame.
The hourly Relative Strength Index (RSI) remains flat but holds above the midline in the bullish region, suggesting there could be more room to the upside.
The bullish crossover, with the 21-HMA cutting the 100-HMA from below, also backs the case for additional gains.
Therefore, the bulls could head towards the horizontal trendline resistance (orange line) at 0.7244 should they take out the daily high of 0.7334. Acceptance above the robust resistance could call for a test of 0.7400.
Alternatively, the 50-HMA at 0.7305 will likely cap the immediate decline, below which the strong support at $7300 could be challenged. That level is where the 21-HMA intersected the 100-HMA.
A failure to resist above the last, the bears will look to test the 200-HMA support once again.
AUD/USD: Hourly chart
AUD/USD: Additional levels
