- AUD/USD prints two-day winning streak inside a bearish chart pattern.
- Bullish MACD, short-term rising chart also favors further upside to 200-HMA.
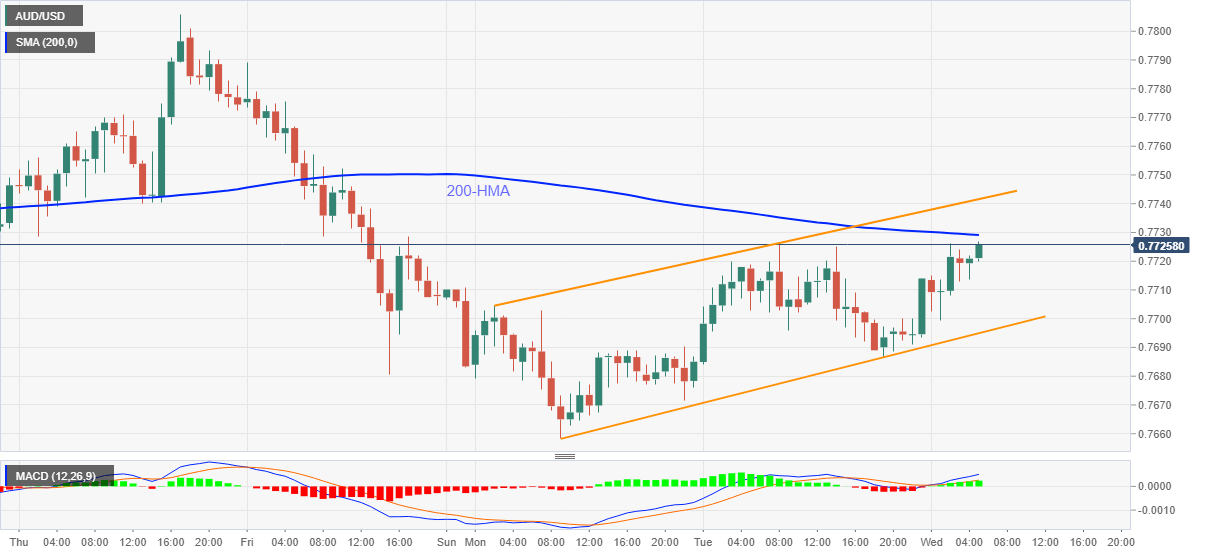
AUD/USD teases intraday top of 0.7726, currently up 0.33% around 0.7721, while heading into the European session on Wednesday.
In doing so, the aussie pair extends while portraying an upward sloping channel. However, the quote’s previous downward trajectory from January 14, coupled with the sustained trading below 200-HMA, highlight the bearish flag chart play that keeps AUD/USD sellers hopeful.
Though, the currently upside momentum eyes 200-HMA, at 0.7730 now, before receding from the stated channel’s resistance line near 0.7740.
Should AUD/USD buyers defy the bearish chart formation by cross 0.7740, their run-up to the monthly top close to the 0.7820 can’t be ruled out. During the rise, January 14 top around 0.7800 can act as an intermediate halt.
Alternatively, a downside break below 0.7695 will confirm the bearish chart pattern and direct AUD/USD sellers towards the theoretical target near mid-0.7500s. The bears may catch a breather around the monthly low of 0.7642 while declining from 0.7695 towards 0.7545.
AUD/USD hourly chart
Trend: Pullback expected
