- AUD/USD witnessed heavy selling for the third straight day and tumbled to fresh multi-month lows.
- The set-up remains tilted in favour of bearish traders and supports prospects for further weakness.
- Only a sustained move back above the 0.7765-70 region will negate the near-term bearish outlook.
The AUD/USD pair witnessed some heavy selling during the early European session and dropped to fresh multi-week lows, around the 0.7675 region in the last hour. The downfall marked the third consecutive day of a negative move and was exclusively sponsored by a broad-based US dollar strength.
From a technical perspective, bearish acceptance below the 0.7700 round-figure mark might have already set the stage for an extension of the recent downward trajectory. The AUD/USD pair seems all set to extend the recent sharp rejection slide from the key 0.8000 psychological mark, or three-year tops.
The bearish outlook is further reinforced by the fact that technical indicators on the daily chart have just started drifting into negative territory. Hence, a subsequent fall towards testing intermediate support, around the 0.7610-0.7600 congestion zone, remains a distinct possibility.
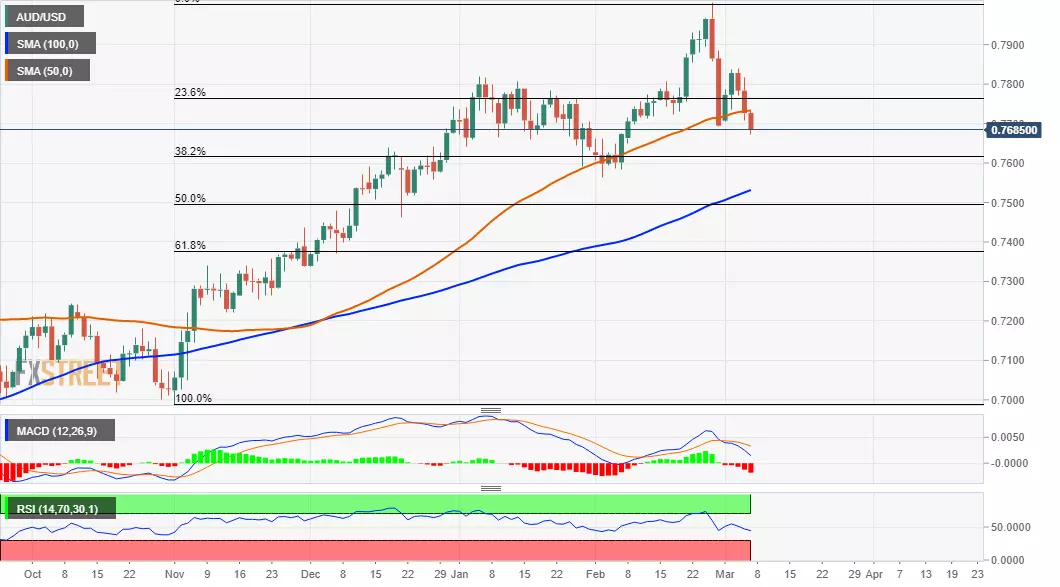
The latter coincides with the 38.2% Fibonacci level of the 0.6990-0.8008 strong positive move. Some follow-through weakness below will be seen as a fresh trigger for bearish traders. The AUD/USD pair might then accelerate the slide towards the 50% Fibo. level, around the 0.7500 round-figure mark.
On the flip side, the 0.7700 level now seems to act as immediate strong resistance. Any further recovery beyond the mentioned handle might still be seen as a selling opportunity and runs the risk of fizzling out rather quickly near the 23.6% Fibo. level, around the 0.7765-70 region.
The AUD/USD pair needs to decisively break through the said hurdle to negate the near-term bearish outlook. This, in turn, might trigger a short-covering move, which should assist bulls to reclaim the 0.7800 mark and aim to test the next relevant resistance near the 0.7835-40 supply zone.
AUD/USD daily chart
Technical levels to watch
