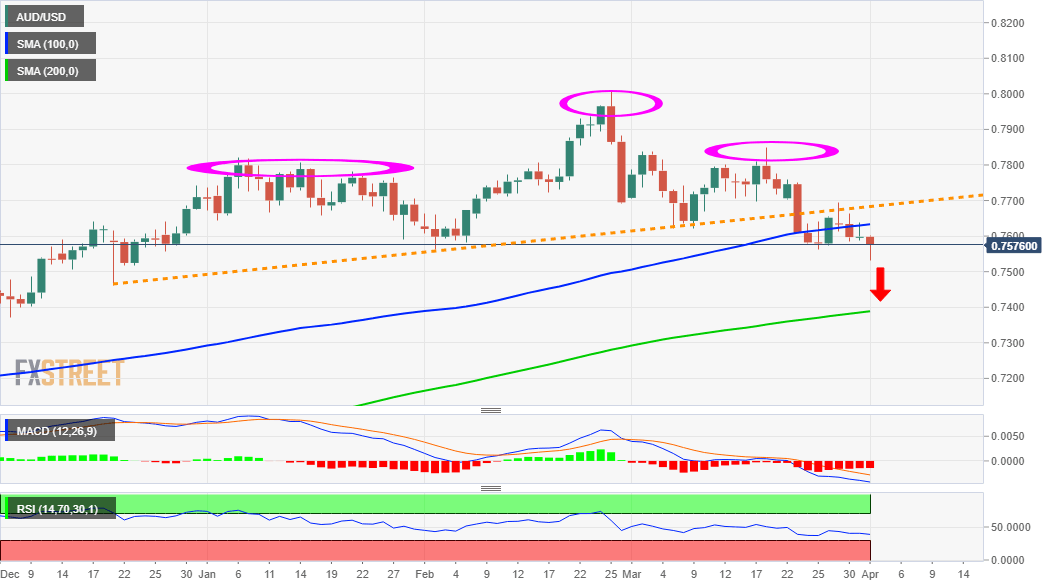
- Oversold RSI on the 1-hour chart prompted some intraday short-covering around AUD/USD.
- A bearish head and shoulder breakdown supports prospects for additional near-term losses.
- The 100-day SMA, around the 0.7620 region should cap any meaningful recovery attempts.
The AUD/USD pair witnessed some heavy selling during the early part of the trading action on Thursday and dived to the lowest level since late December, around the 0.7530 region.
However, oversold RSI (14) on the 1-hour chart prompted some intraday short-covering bounce and assisted the pair to trim a part of its early lost ground. Retreating US Treasury bond yields kept the US dollar bulls on the defensive, which, in turn, was seen as a key factor that extended some support to the AUD/USD pair.
Looking at the broader picture, this week’s failure near the 0.7660-65 area validates the head-and-shoulders pattern breakdown and supports prospects for further weakness. The mentioned region marks the neckline support breakpoint of the bearish pattern and should act as a key pivotal point for short-term traders.
Meanwhile, technical indicators on 4-hour/daily charts are holding deep in the bearish territory and are still far from being in the oversold zone. Hence, any subsequent recovery might still be seen as a selling opportunity near the 0.7600 mark. This, in turn, should cap the AUD/USD pair near the 100-day SMA, around the 0.7620 region.
On the flip side, the daily swing lows, around the 0.7530 region now becomes immediate support to defend. This is followed by the key 0.7500 psychological mark, which if broken decisively will add credence to the bearish outlook and pave the way for an extension of the recent sharp pullback from three-year tops.
The next relevant support to the downside is pegged near the 0.7460 region before the AUD/USD pair eventually slides further to the 0.7400 mark. The downward trajectory could further get extended and allow bearish traders to challenge the very important 200-day SMA support, currently near the 0.7375 region.
AUD/USD daily chart
Technical levels to watch
