- AUD/USD bulls catch a breather after three-day winning streak.
- Sustained trading beyond 200-hour EMA, weekly support line keeps buyers hopeful.
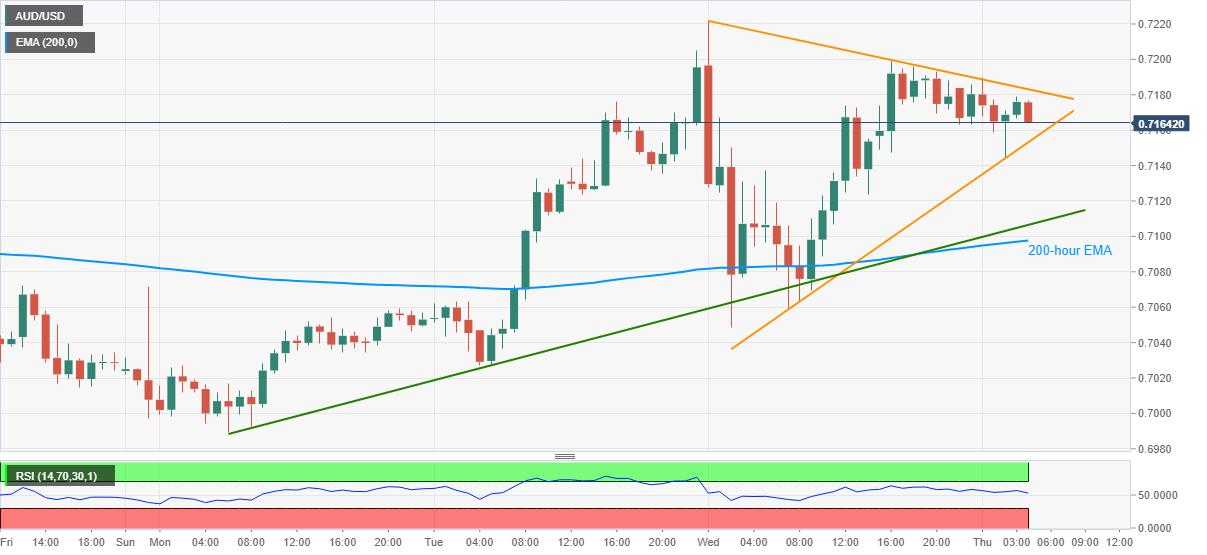
AUD/USD wavers around 0.7170/75 while heading into Thursday’s European session open. The pair rose to a three-week high the previous day before stepping back from 0.7222.
However, a successful U-turn from 200-hour EMA and an ascending trend line from November 02 join strong RSI conditions to favor the buyers.
As a result, AUD/USD bulls await fresh entries above the resistance line of the adjacent triangle, at 0.7185 now, before targeting the 0.7200 and Wednesday’s top near 0.7225.
While anticipated overbought RSI conditions may pause the pair’s further upside past-0.7225, October’s peak surrounding 0.7244 could lure the optimists afterward.
In a case where the pair drops below the stated triangle’s support line, currently around 0.7155, an ascending trend line from Monday, at 0.7105 now, will be on the intraday sellers’ radar.
Also likely to challenge the AUD/USD bears is a 200-hour EMA line near 0.7095, a break of which can probe yesterday’s low of 0.7048.
AUD/USD hourly chart
Trend: Sideways
