- AUD/USD bulls moving in on key territory on last push before Christmas.
- RBA fundamentals stacked against the Aussie for 2020, but technically, bullish.
AUD/USD is closing in on positive territories and the post ‘phase-one’ trade deal highs scored back on the 13th of December, positioning for a close through the 200-day moving average.
AUD/USD is currently trading at 0.6922 having travelled from a low of 0.6891 to a high of 0.6928 and bulls now have eyes of the 0.70 handle on both a fundamental and technical basis. However, caution is warned considering the Reserve Bank of Australia notes signs of slowing domestic growth that could mean that QE comes into view in 2020 – subsequently, AUD net shorts pushed higher last week according to the latest CFTC report.
For AUD to prosper in a risk-on environment solely driven by traction on trade talks between the US and China, the US dollar will need to deteriorate further. The greenback is already consolidating in a bearish trend and below a bearish daily wedge formation on the charts, but it has staying power which could be troublesome for the Aussie bulls. All it would take is a series of impressive US economic data, and/or a flip in trade deal sentiment, and the Aussie would plummet.
Path of least resistance
The path of least resistance for the Aussie on a fundamental basis could be arguably lower, for it has barely recovered from the 2018 downtrend lows despite a less hawkish Federal Reserve in mid-2019.
“Our base case for the A$ is that it should weaken Q1/ Q2 2020 as the impact of the forecast Feb and June RBA rate cuts plus the beginning of a weakening in iron ore prices ($80 by June) kicks in,” analysts at Westpac argued, who, back in May, noted that a fair value was set to range between 0.64 to 0.69 in the second half of 2019 – a pretty accurate call. The analyst’s view, (RBA to cut Feb and June before QE), is contrary to the bullish technical forecasts above the 200-DMA.
“We would view any strength through the end of 2019 to 0.6950 as an opportunity to sell.”
AUD/USD levels
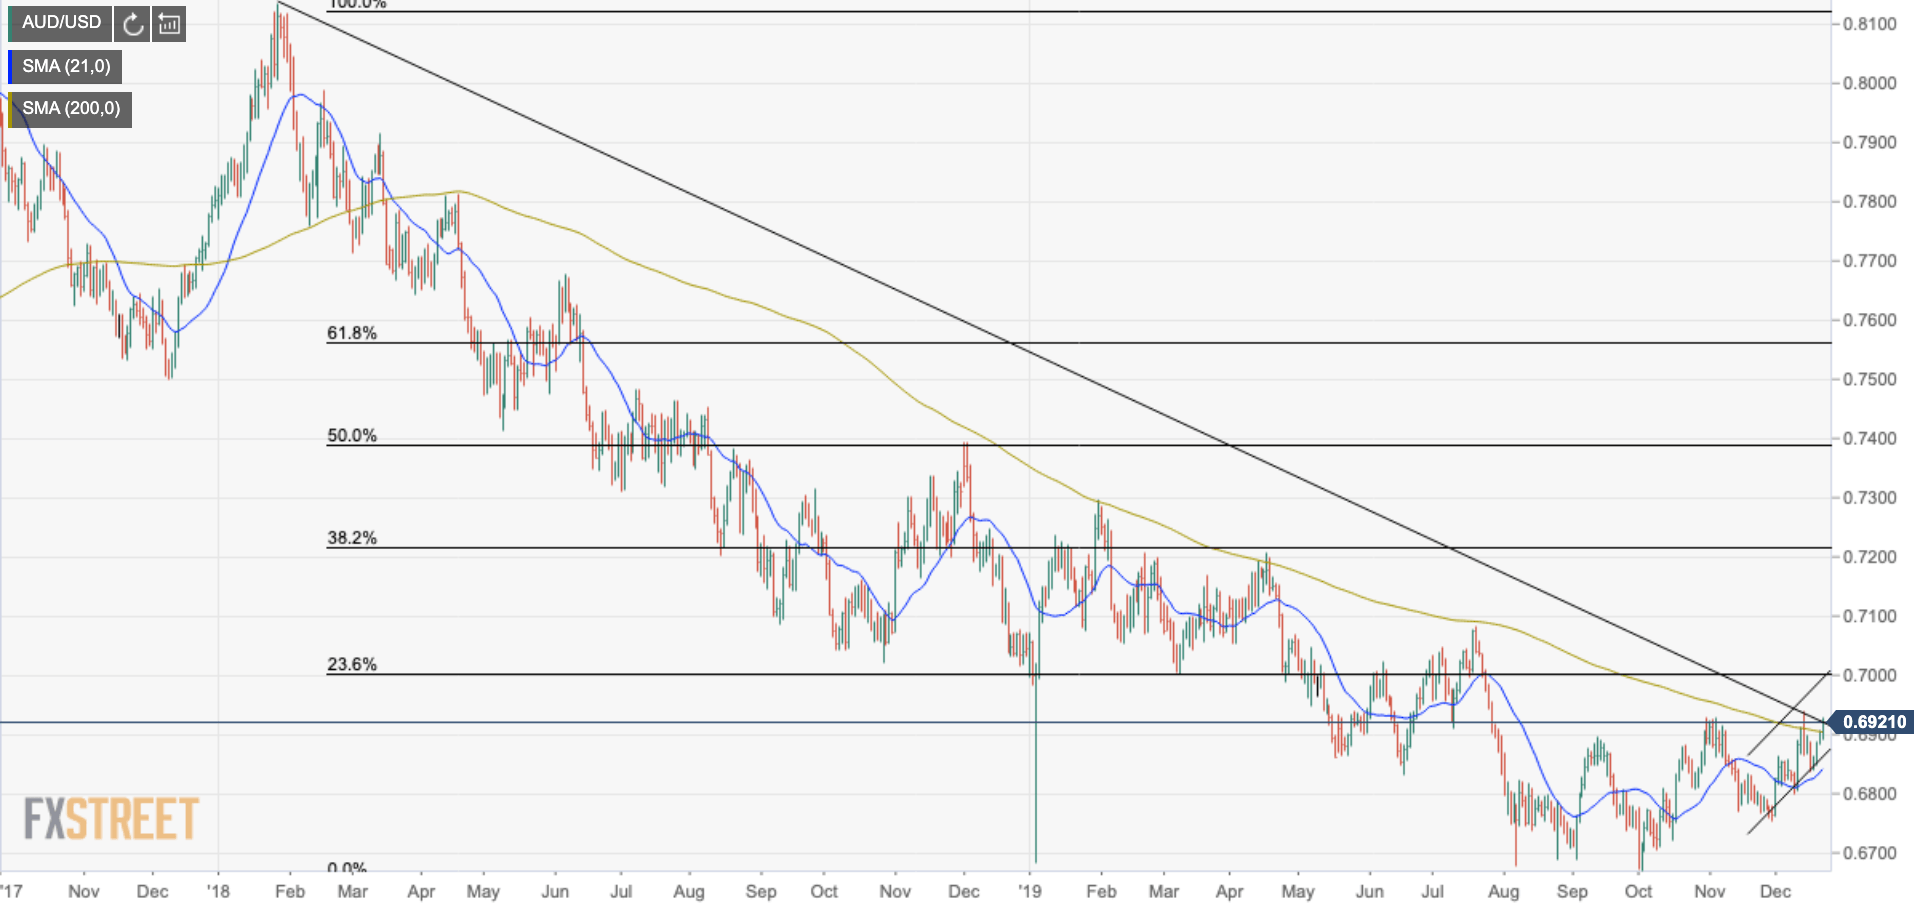
- AUD/USD popped through the Jan 2018 and December 2018 trend line resistance earlier in the month, but bears emerged and sent the price back to the 21-day moving average which held.
- This is termed as a fake-out, rather than a breakout, and the prudent bulls would have regarded this is a possible opportunity to buy the dip so long as price stablised around the prior resistance line/turned support and corrected higher to break the prior highs.
- The price action is following this classic playbook as the bulls indeed close in on the prior highs of 0.6938 and are set to close above the 200-DMA.
- A 23.6% Fibonacci retracement of the Jan. 2018 downtrend is located around 0.7010, in line with the March lows as a first key target which has a confluence of an ascending channel resistance which could be expected to hold the first test.
- The less optimistic bulls will expect the price action to respect the channel’s rules, with the price reverting back to the downside within the channel to rising channel support, somewhere below the 0.69 handle again.
- So long as the channel holds, a bullish bias will persist.
- A break of channel resistance will target the mid-July highs around 0.7080.
