- AUD/USD is 0.84% lower on the session but has moved up from the session lows.
- The pullback has stalled at the 55 Exponential Moving Average (EMA).
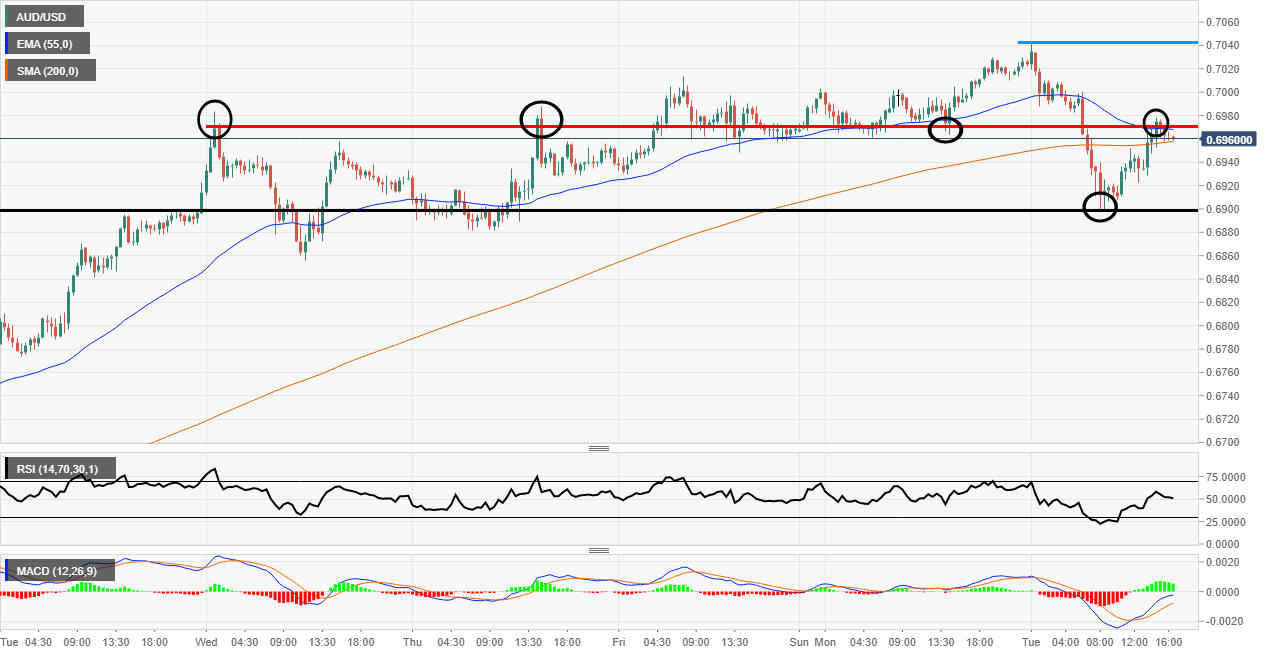
AUD/USD 30-min chart
In recent weeks AUD/USD has been on a great run but over the last session, the price has moved lower by 0.84%. This is not as bad as things could have been as the price was as low as 0.6898 (-1.82%) at one stage on Tuesday.
Looking at the chart below the price has now found some resistance again at the 55 EMA. There seems to be some indecision as there are now some “doji” candles ahead of the 0.70 psychological level.
The indicators are also pretty indecisive as the MACD histogram is green but the signal lines are under the mid-level. The Relative Strength Index (RSI) is also languishing around the 50 mark with no real clear direction. It seems that the RSI might break the 50 mid-point as the signal line is pointing lower, this would be a bearish signal.
On the higher timeframes, the move higher seems pretty overextended to the upside but as of yet, no real lower high lower low pattern has been created. On this 30-minute chart, that would happen if 0.6898 level gets broken to the downside. Maybe then the pair might correct further.
Additional levels
