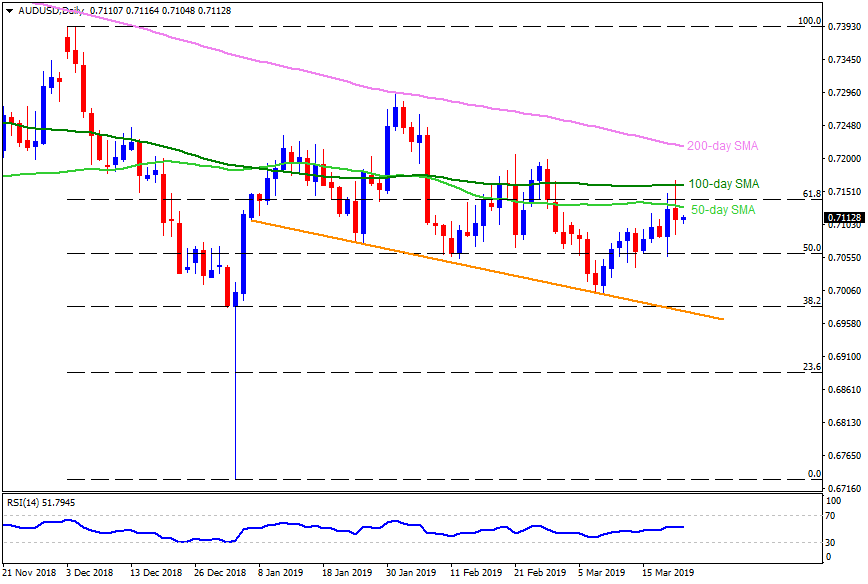
AUD/USD daily chart
- The AUD/USD pair trades near 0.7110 around early Asian sessions on Friday.
- The quote took a U-turn from 50-day and 100-day simple moving averages (SMA) on Thursday.
- While multiple lows from mid-February to March start offers immediate support to the pair at 0.7070, 50% Fibonacci retracement of its December – January drop, at 0.7060, could challenge sellers then after.
- Given the additional declines under 0.7060, 0.7030, 0.7000 and a descending trend-line joining 38.2% Fibonacci at 0.6980 seem crucial for bears.
- Meanwhile, 50-day SMA level of 0.7130 and 100-day SMA level of 0.7160 can limit the pair’s near-term upside.
- Should the pair clears 0.7160, 0.7200 may become buyers’ favorite ahead of pushing them towards 200-day SMA level of 0.7220.
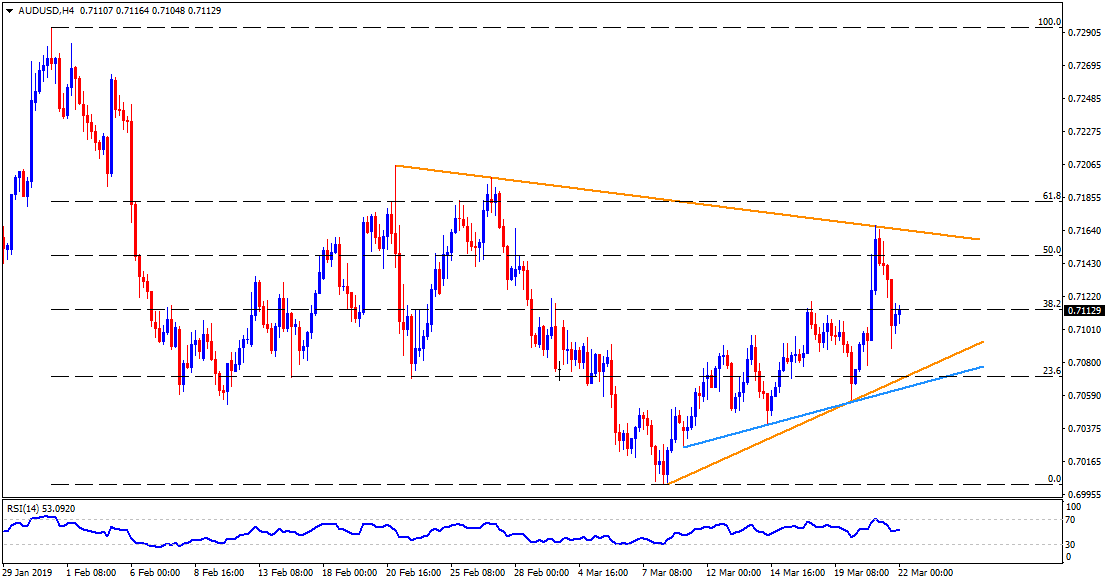
AUD/USD 4-Hour chart
- Short-term symmetrical triangle confines the pair moves between 0.7070 and 0.7165 with additional support-line at 0.7060 acting as small follow-on rest.
- 50% Fibonacci retracement of January 31 to March 08 downturn at 0.7150 can provide an intermediate halt between 0.7130 and 0.7150.
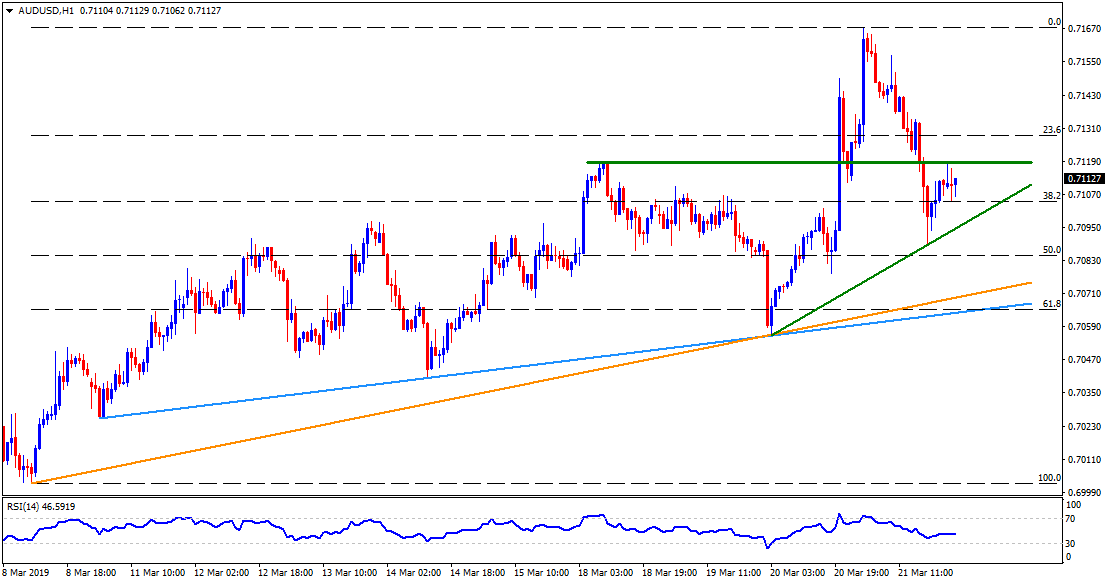
AUD/USD hourly chart
- A horizontal line near 0.7120 may restrict the pair’s adjacent rise whereas 0.7095 seems the closest support.