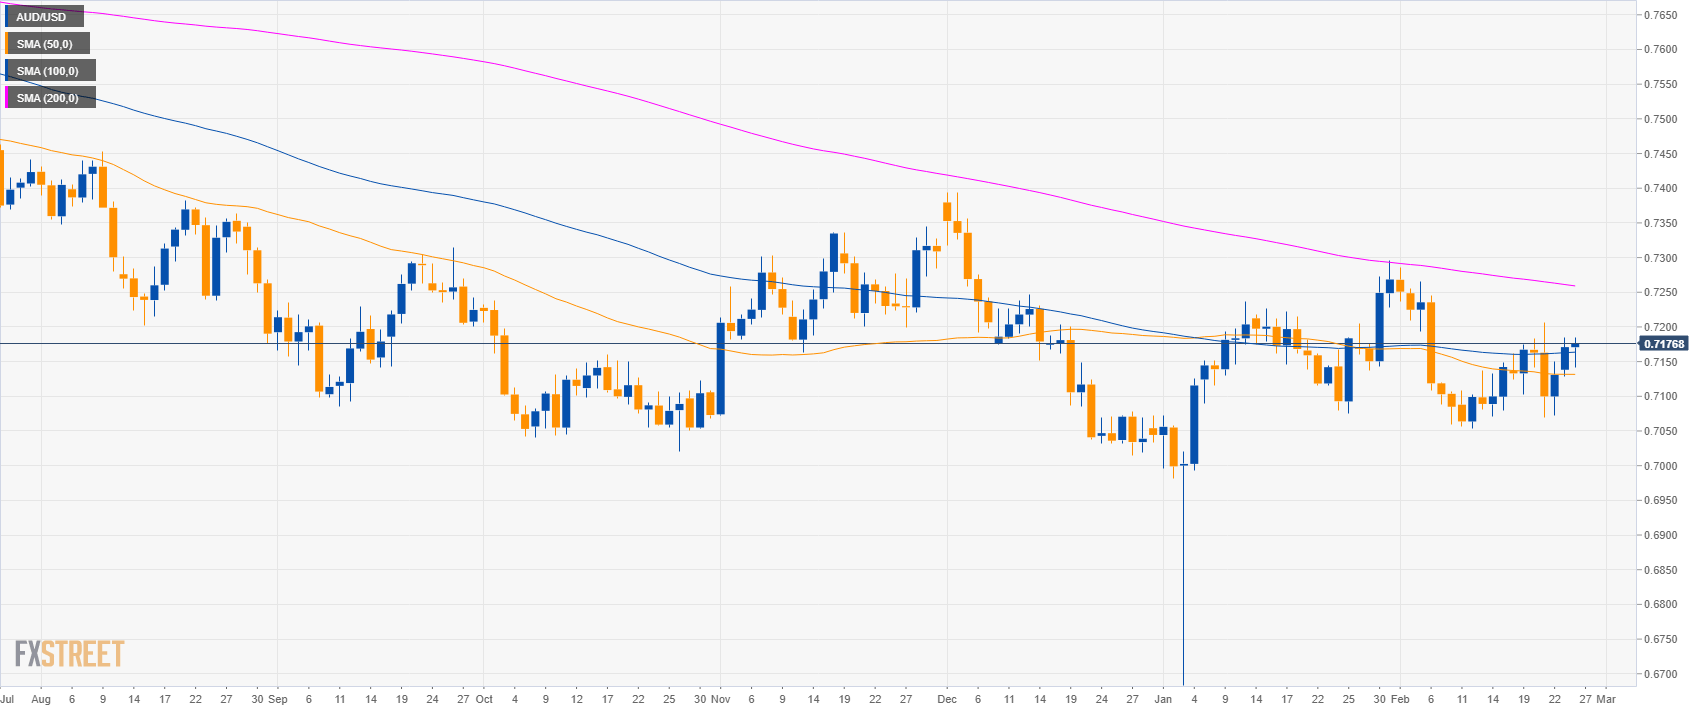
AUD/USD daily chart
- AUD/USD is trading between the 100 and 200 simple moving averages (SMAs) suggesting a sideways market.
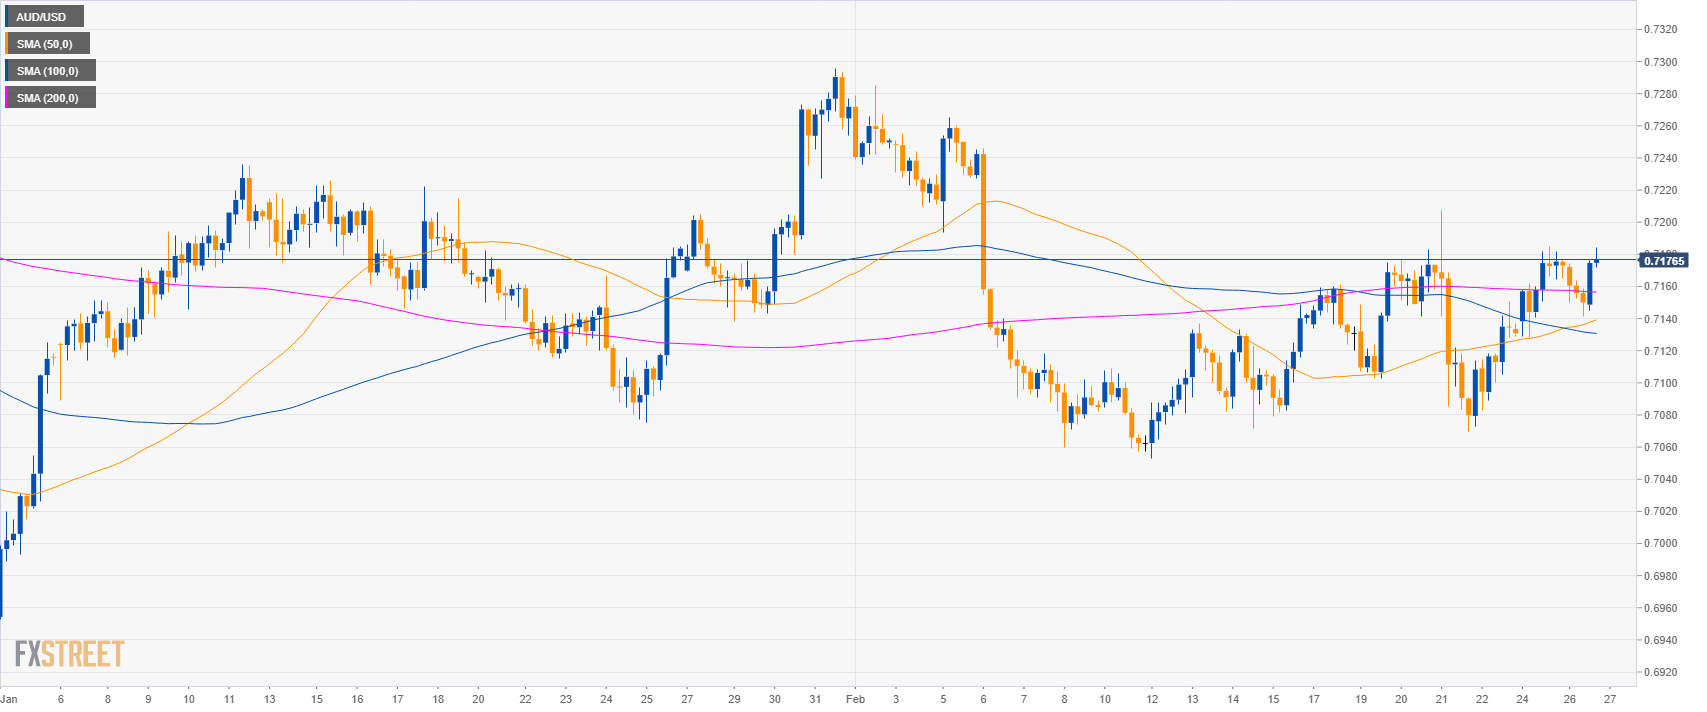
AUD/USD 4-hour chart
- AUD/USD is trading above its main SMAs suggesting a bullish bias in the medium-term.
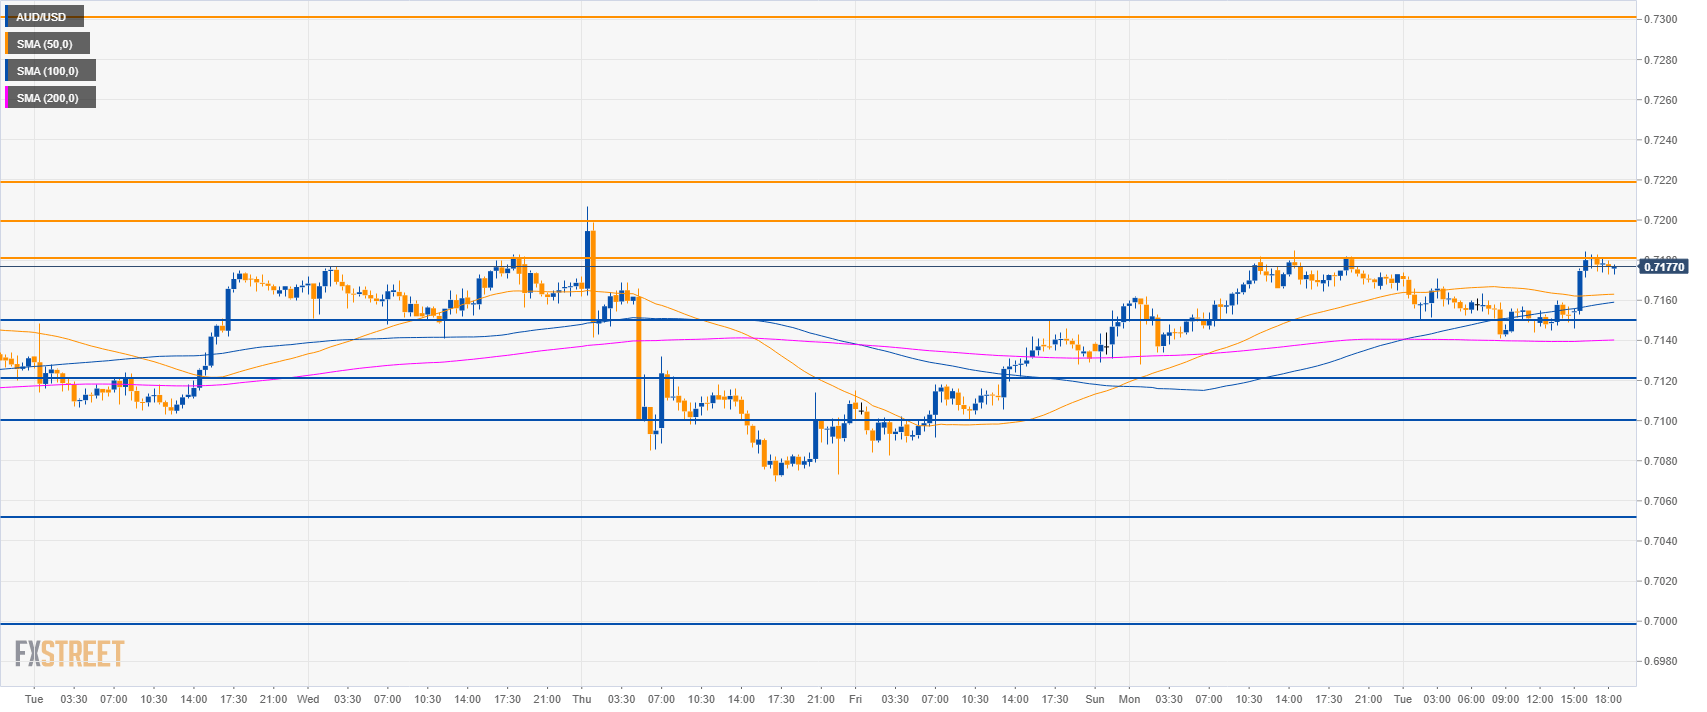
AUD/USD 30-minute chart
- AUD/USD is trading above its main SMAs suggesting bullish momentum in the short-term.
- Bulls have to break above 0.7180 resistance to travel to 0.7220 and ultimately to 0.7300 to the upside.
- Support is at 0.7150, 0.7120 and 0.7100 figure.
Additional key levels
AUD/USD
Overview:
Today Last Price: 0.7176
Today Daily change: 5 pips
Today Daily change %: 0.07%
Today Daily Open: 0.7171
Trends:
Daily SMA20: 0.7152
Daily SMA50: 0.7132
Daily SMA100: 0.7163
Daily SMA200: 0.7261
Levels:
Previous Daily High: 0.7185
Previous Daily Low: 0.7128
Previous Weekly High: 0.7207
Previous Weekly Low: 0.707
Previous Monthly High: 0.7296
Previous Monthly Low: 0.6684
Daily Fibonacci 38.2%: 0.7163
Daily Fibonacci 61.8%: 0.715
Daily Pivot Point S1: 0.7138
Daily Pivot Point S2: 0.7104
Daily Pivot Point S3: 0.7081
Daily Pivot Point R1: 0.7195
Daily Pivot Point R2: 0.7218
Daily Pivot Point R3: 0.7252
