- The Aussie is under strong selling pressure as the bears are challenging the lowest point in May at 0.6862.
- Bears will be looking for a daily close below 0.6862 which will add some more weight to the bearish case.
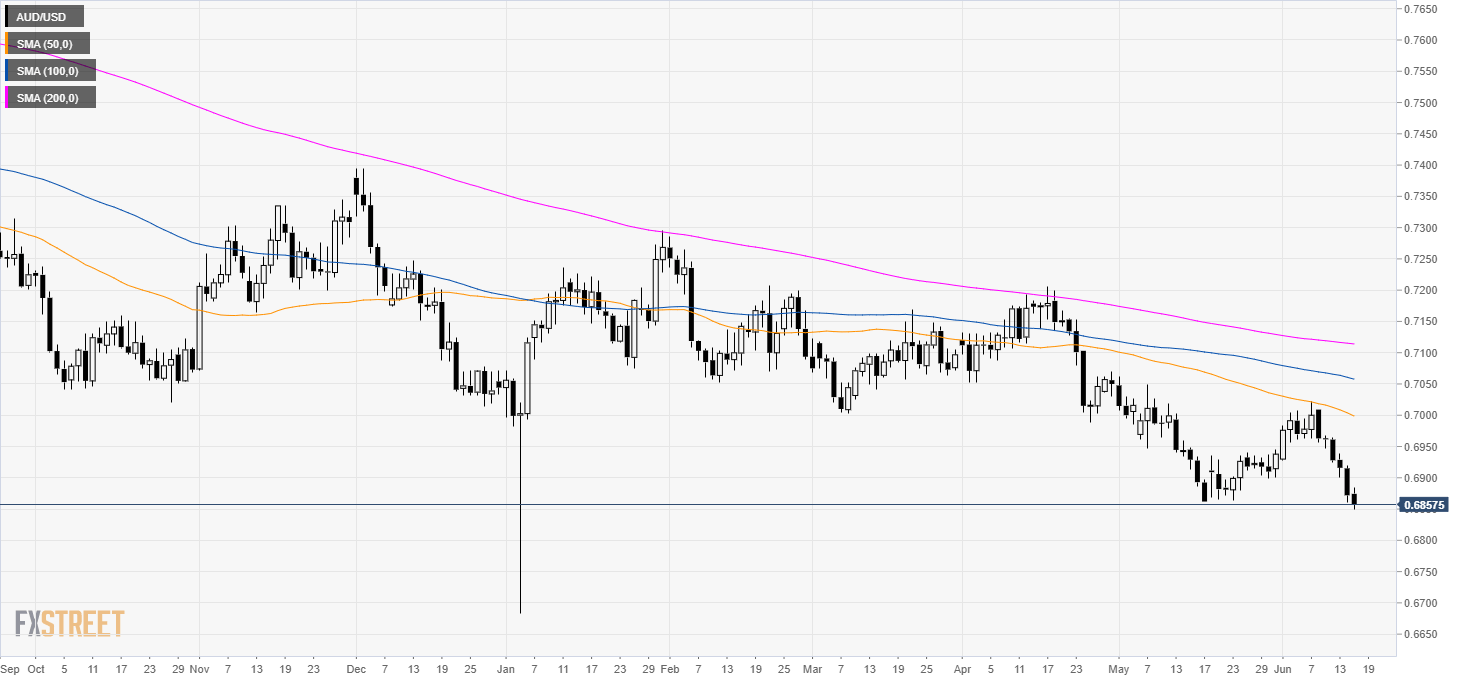
AUD/USD daily chart
AUD/USD is in a bear trend below its main daily simple moving averages (DSMAs). The market is trying to break below the low established in May at 0.6862.
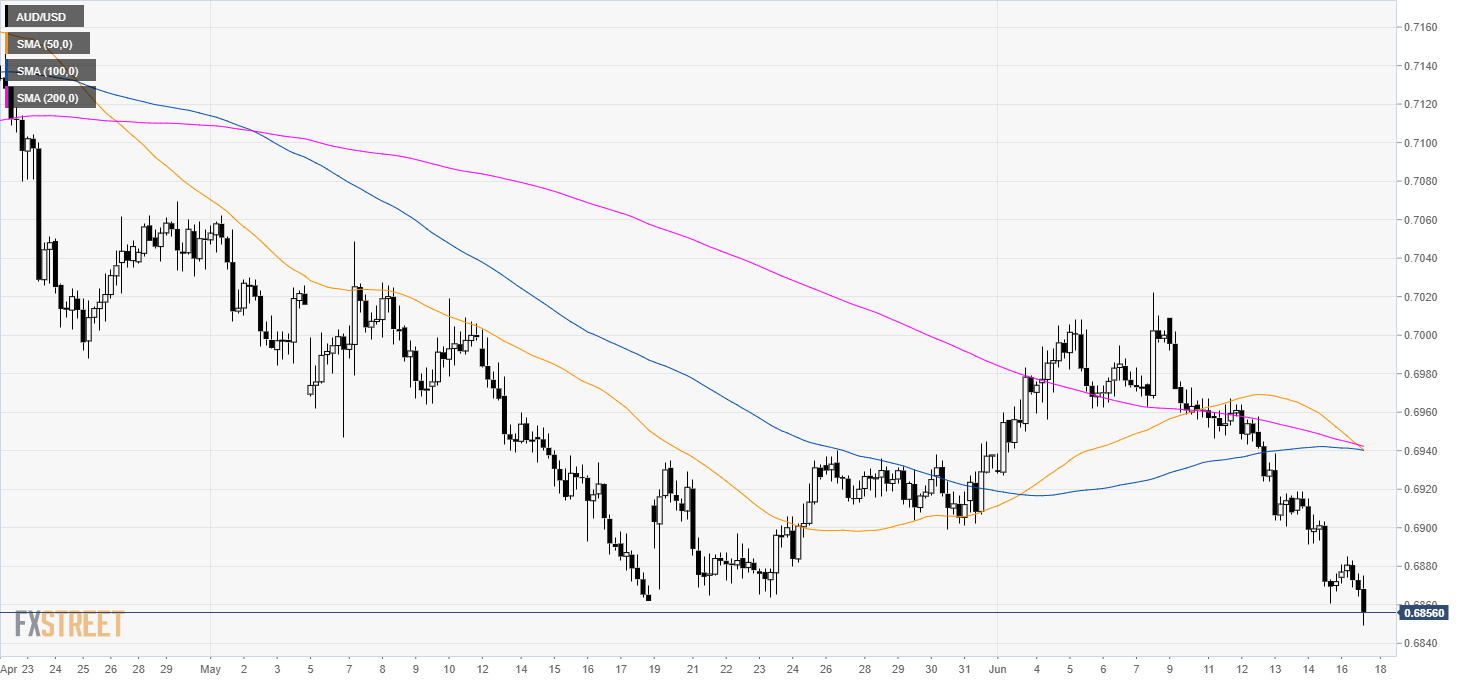
AUD/USD 4-hour chart
AUD/USD is under strong selling pressure below its main SMAs. The 50 SMA is crossing below the 200 SMA which is considered a bearish sign.
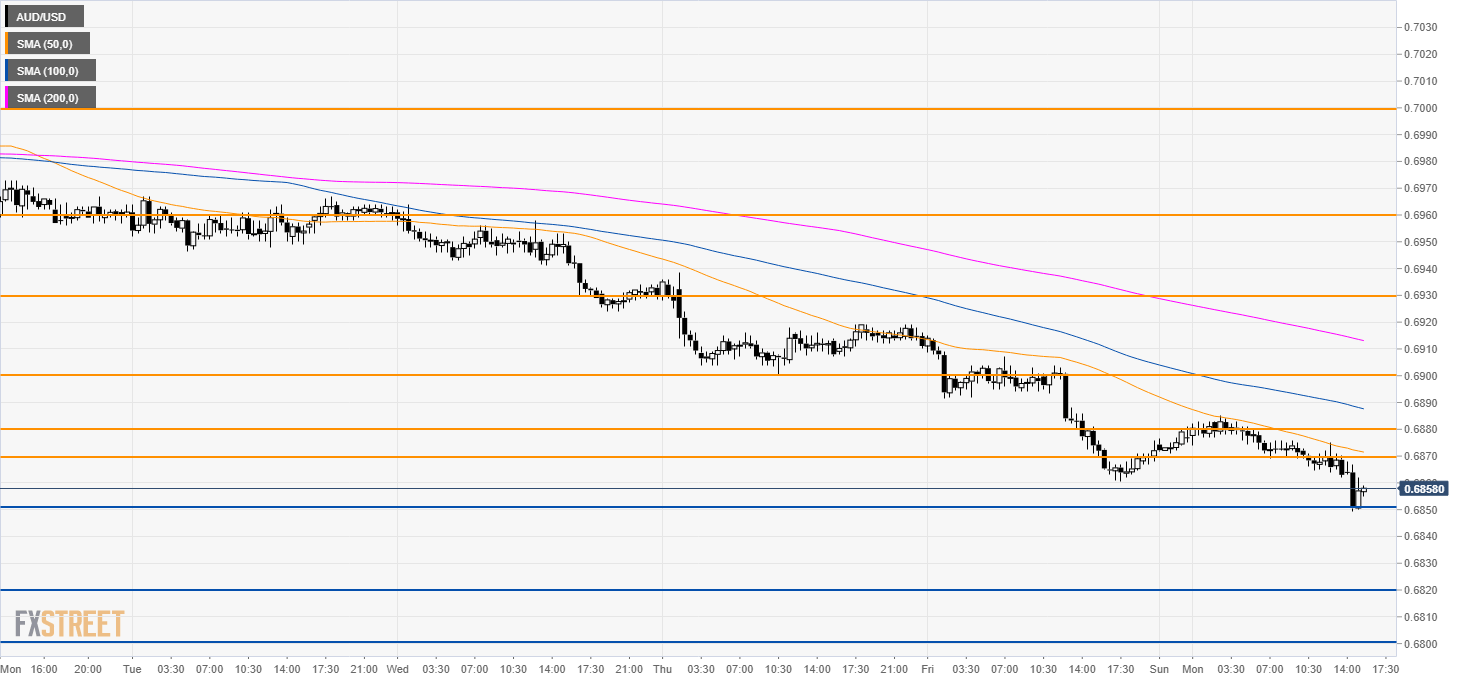
AUD/USD 30-minute chart
AUD/USD is trading below its main SMAs suggesting bearish momentum in the near term. A sustained break below 0.6950 can send the Aussie to 0.6920 and 0.6800 figure. Resistances are seen at 0.6870/0.6880 and 0.6900 level.
Additional key levels
