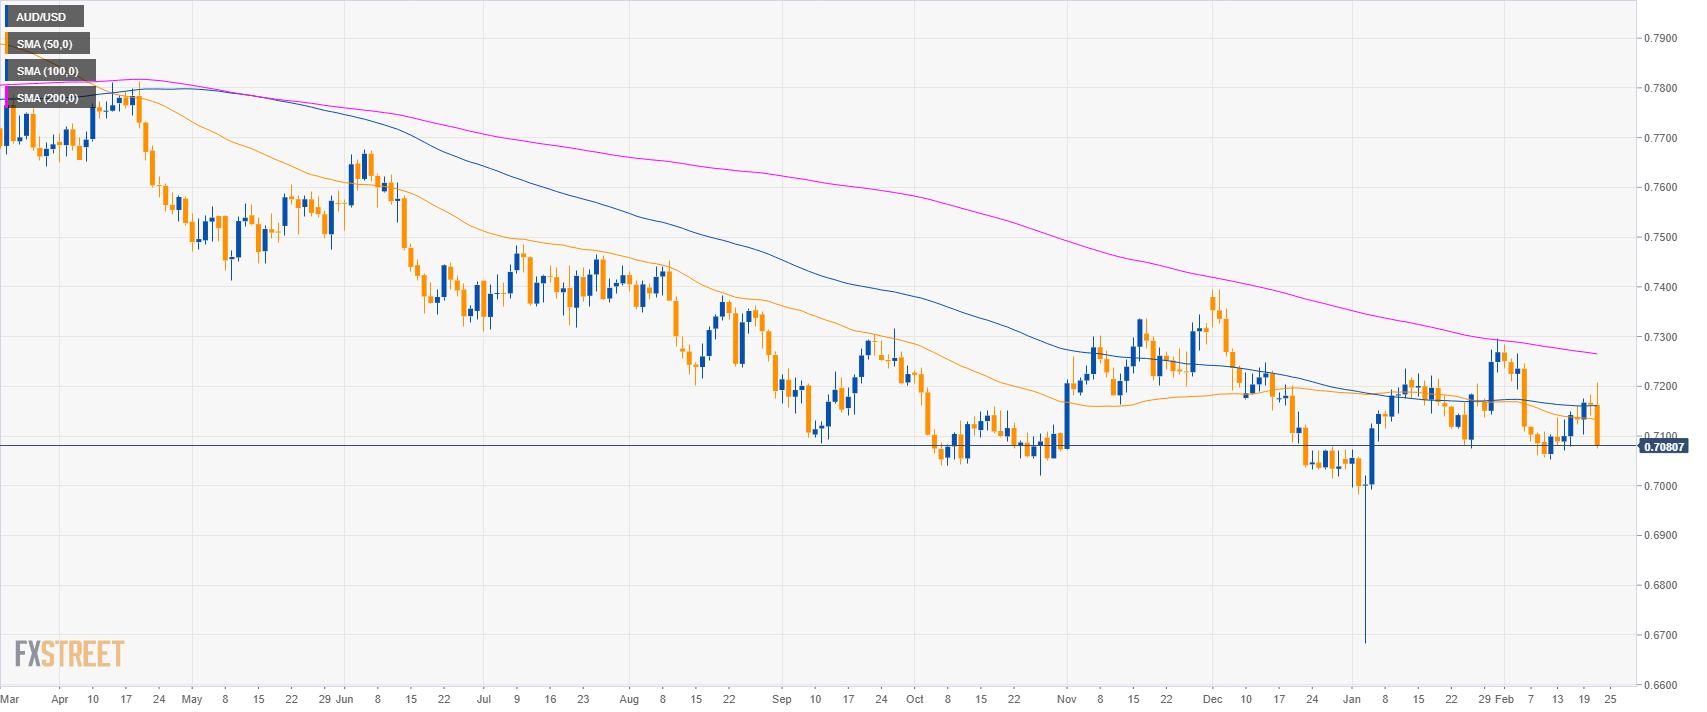
AUD/USD daily chart
- On the daily time-frame, AUD/USD is trading below its main simple moving averages suggesting bearish momentum.
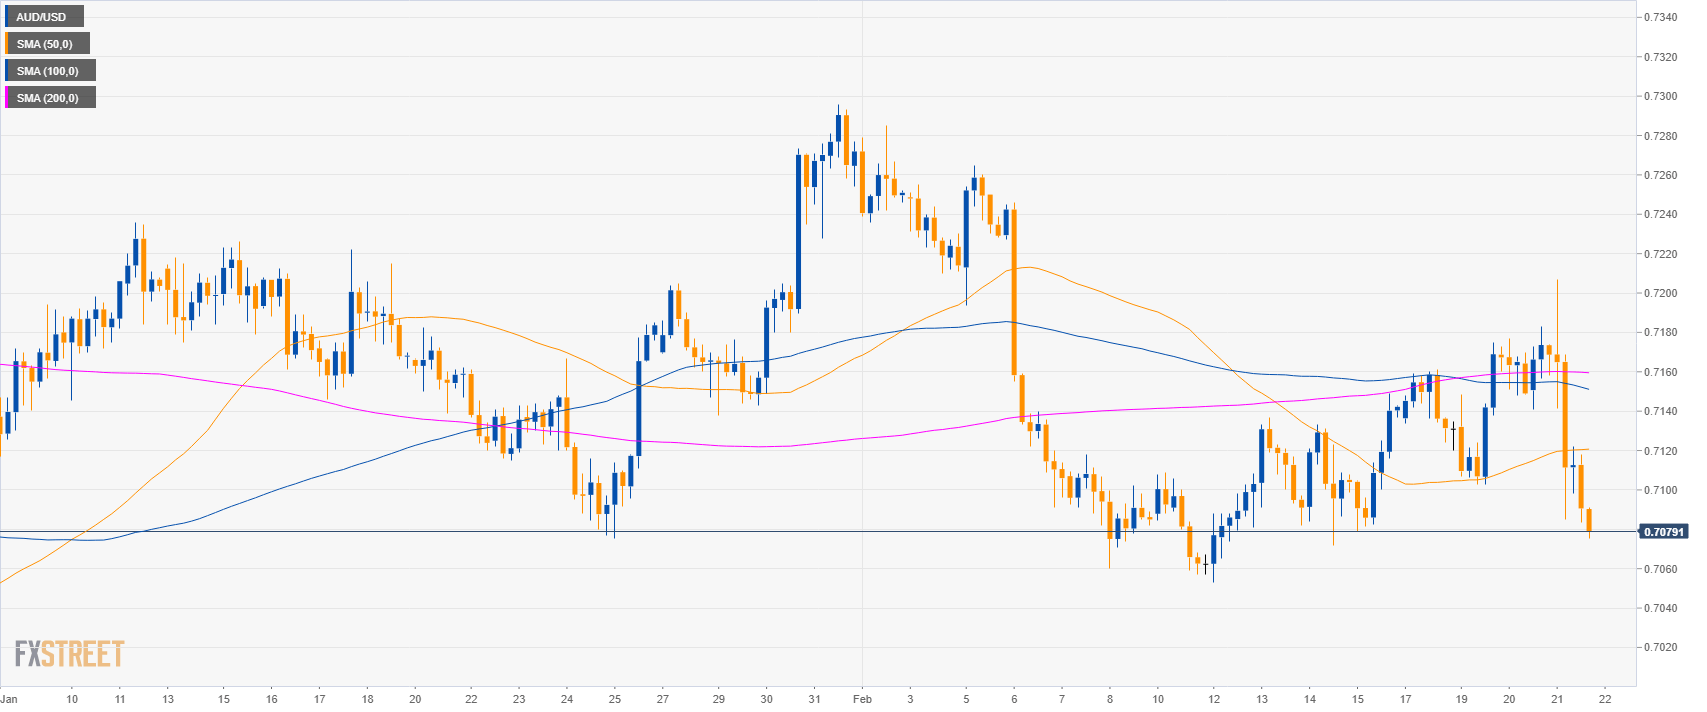
AUD/USD 4-hour chart
- AUD/USD is trading below its main SMAs suggesting bearish momentum in the medium-term.
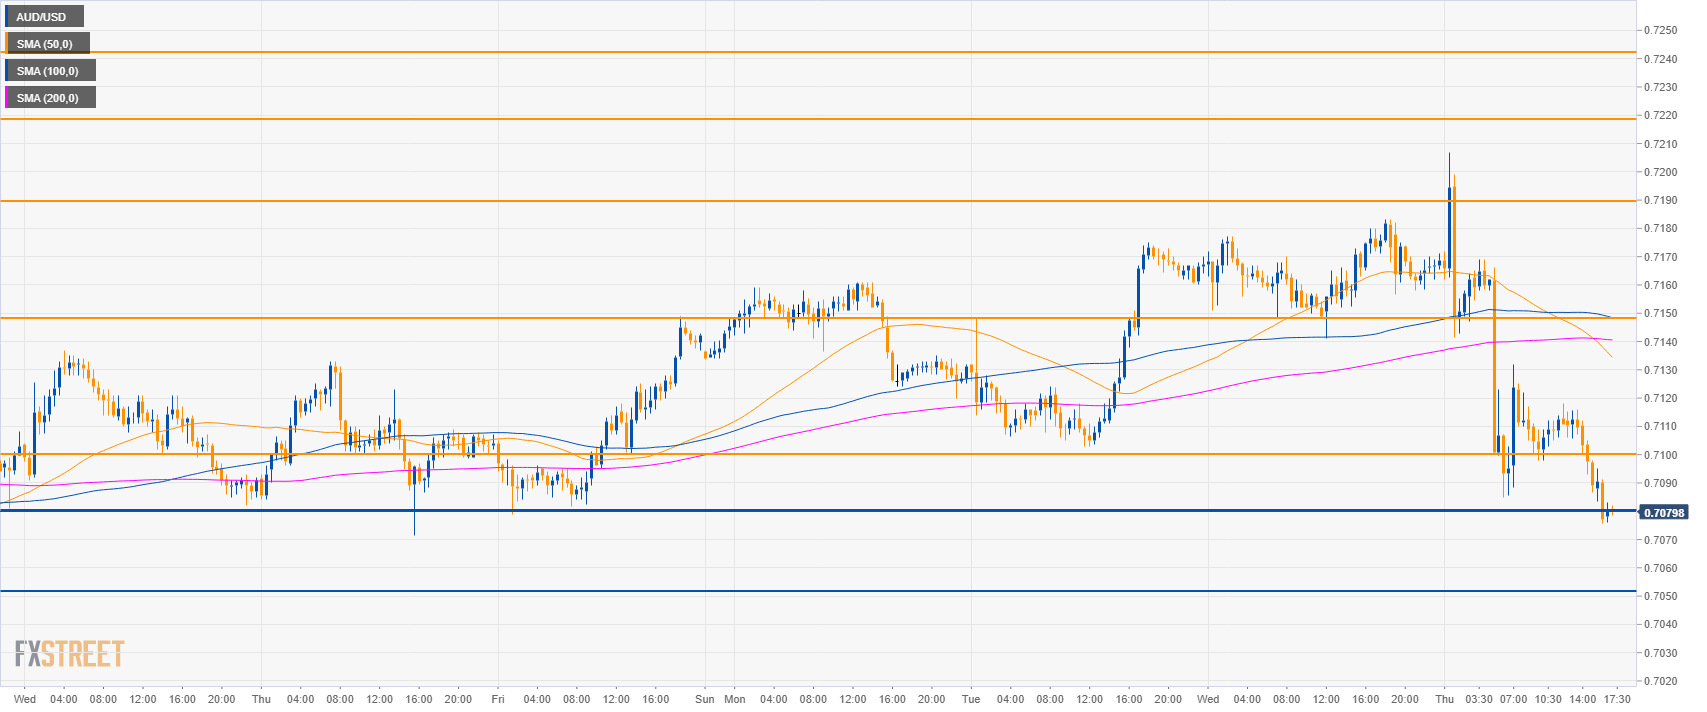
AUD/USD 30-minute chart
- AUD/USD is trading below its main SMAs suggesting bearish momentum in the short-term.
- Bears need to break below 0.7080 level to reach 0.7050 to the downside.
- Resistances are seen at 0.7100 figure and 0.7150 level.
Additional key levels:
AUD/USD
Overview:
Today Last Price: 0.708
Today Daily change: -83 pips
Today Daily change %: -1.16%
Today Daily Open: 0.7163
Trends:
Daily SMA20: 0.7154
Daily SMA50: 0.7135
Daily SMA100: 0.7161
Daily SMA200: 0.7267
Levels:
Previous Daily High: 0.7183
Previous Daily Low: 0.7141
Previous Weekly High: 0.7149
Previous Weekly Low: 0.7053
Previous Monthly High: 0.7296
Previous Monthly Low: 0.6684
Daily Fibonacci 38.2%: 0.7157
Daily Fibonacci 61.8%: 0.7167
Daily Pivot Point S1: 0.7142
Daily Pivot Point S2: 0.712
Daily Pivot Point S3: 0.71
Daily Pivot Point R1: 0.7184
Daily Pivot Point R2: 0.7204
Daily Pivot Point R3: 0.7226
