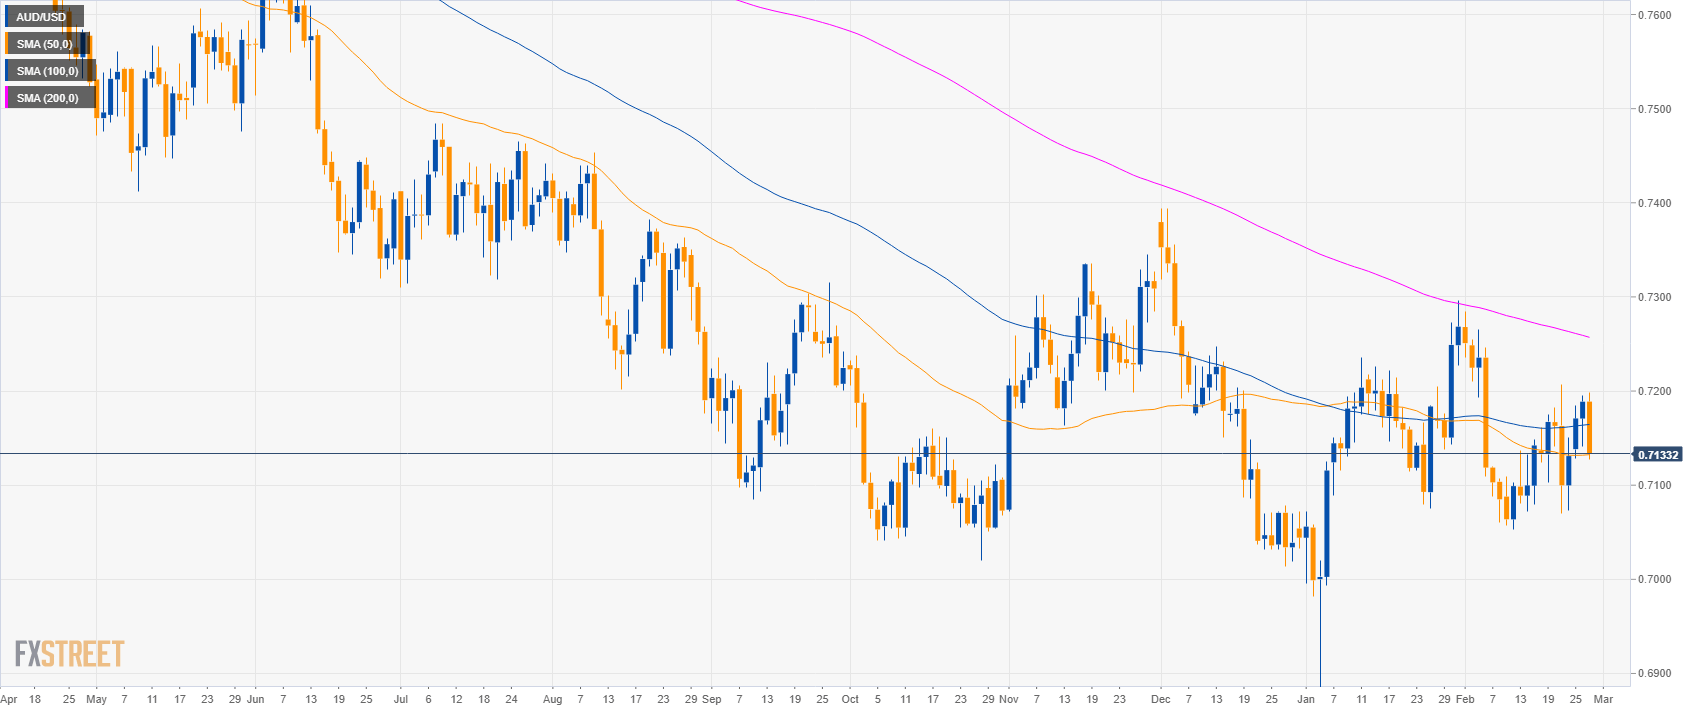
AUD/USD daily chart
- AUD/USD is trading in a bear trend below its 200-day simple moving averages (SMA).
- AUD/USD is currently testing the 0.7130 level and the 50 SMA.
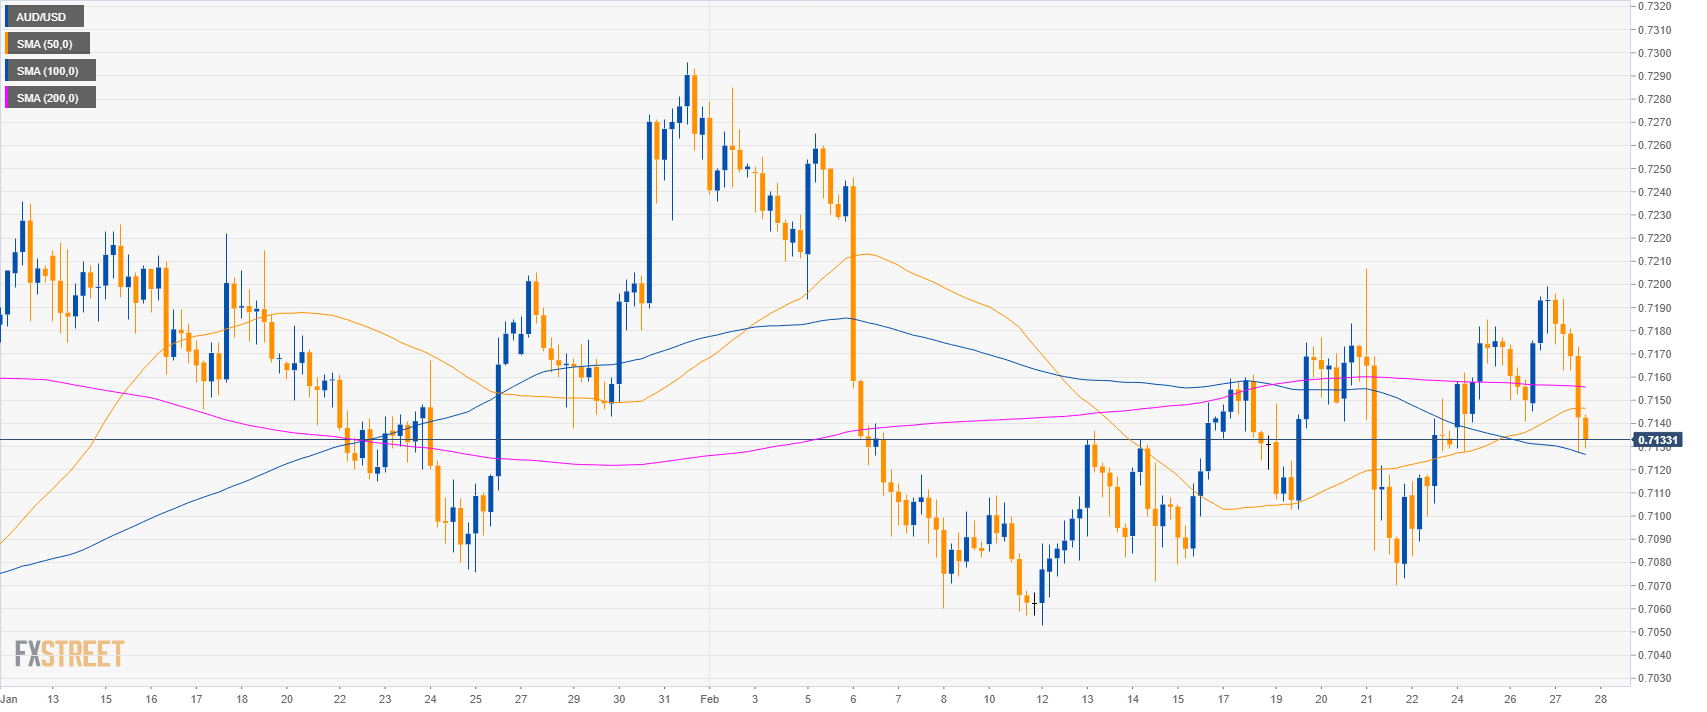
AUD/USD 4-hour chart
- AUD/USD is testing the 100 SMA on the 4-hour chart.
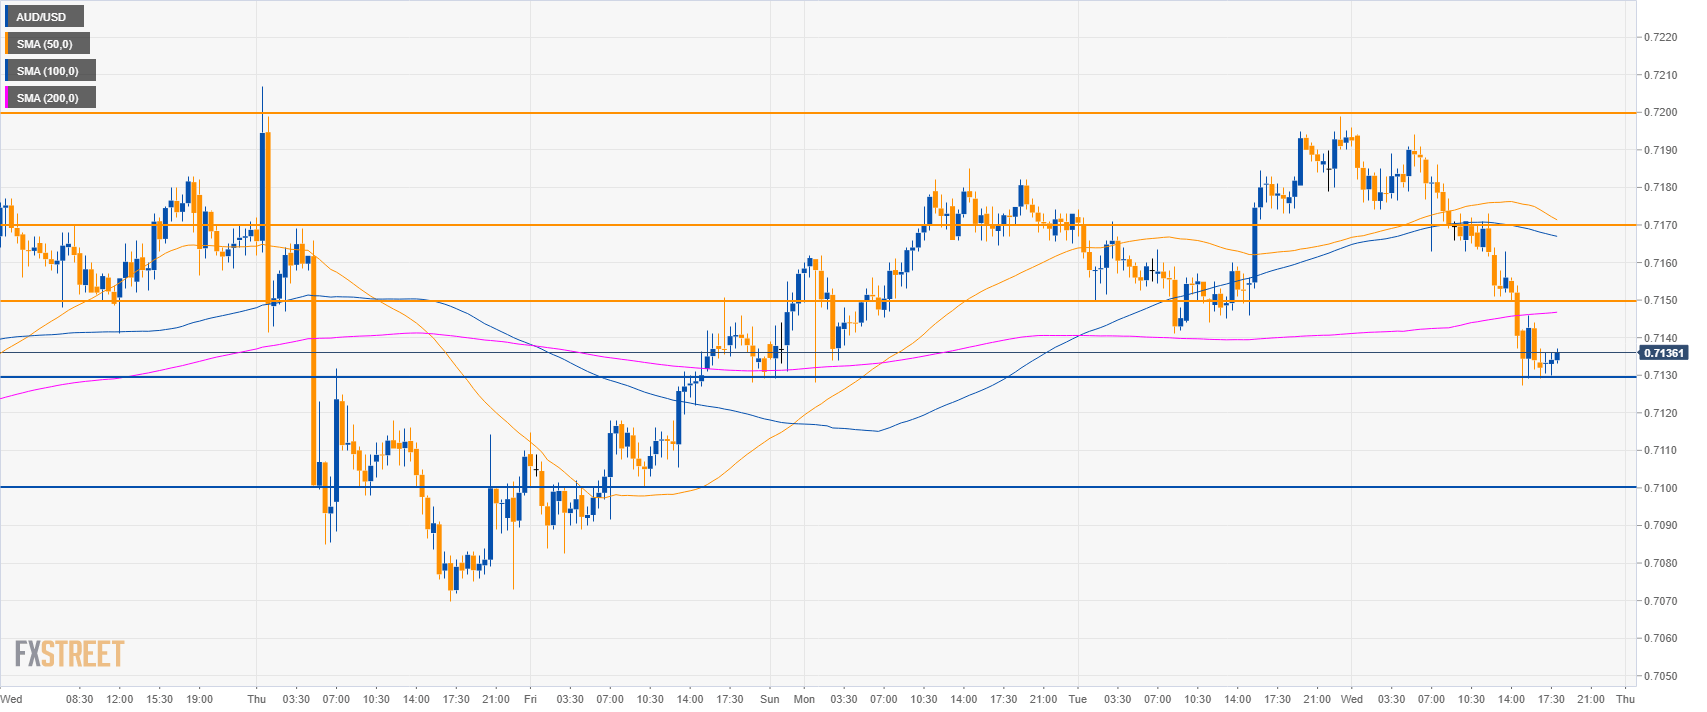
AUD/USD 30-minute chart
- AUD/USD is trading below its main SMAs suggesting bearish momentum in the short-term.
- However, 0.7130 and the 50 SMA on the daily chart are expected to provide solid support with bulls soon targeting 0.7150, 0.7170 and 0.7200 in the short-term.
- A strong break below 0.7130 would invalidate the bullish scenario and open the doors to 0.7100 the figure.
Additional key levels
AUD/USD
Overview:
Today Last Price: 0.7134
Today Daily change: -55 pips
Today Daily change %: -0.77%
Today Daily Open: 0.7189
Trends:
Daily SMA20: 0.7154
Daily SMA50: 0.7132
Daily SMA100: 0.7164
Daily SMA200: 0.7259
Levels:
Previous Daily High: 0.7195
Previous Daily Low: 0.7141
Previous Weekly High: 0.7207
Previous Weekly Low: 0.707
Previous Monthly High: 0.7296
Previous Monthly Low: 0.6684
Daily Fibonacci 38.2%: 0.7174
Daily Fibonacci 61.8%: 0.7162
Daily Pivot Point S1: 0.7155
Daily Pivot Point S2: 0.7121
Daily Pivot Point S3: 0.7101
Daily Pivot Point R1: 0.7209
Daily Pivot Point R2: 0.7229
Daily Pivot Point R3: 0.7263
