- The Aussie is trading at weekly highs into the Friday close.
- The level to beat for bulls is the 0.6860 level, followed by 0.6878 resistance.
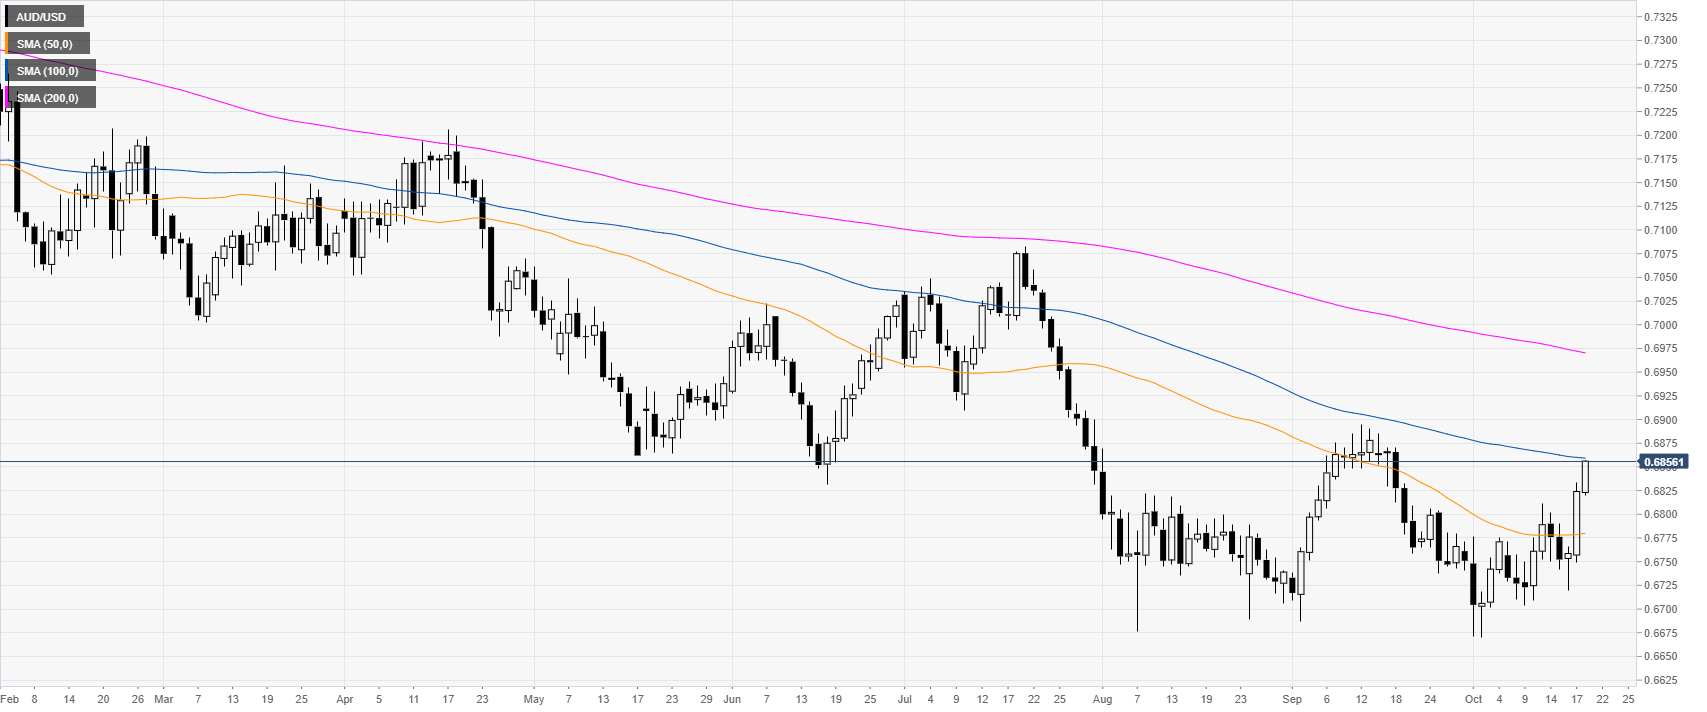
AUD/USD daily chart
The Aussie is trading in a downtrend below its 100 and 200-day simple moving averages (DSMAs) on the daily chart. However, in October, the market has been rebounding sharply to almost reach the 100 SMA at 0.6859.
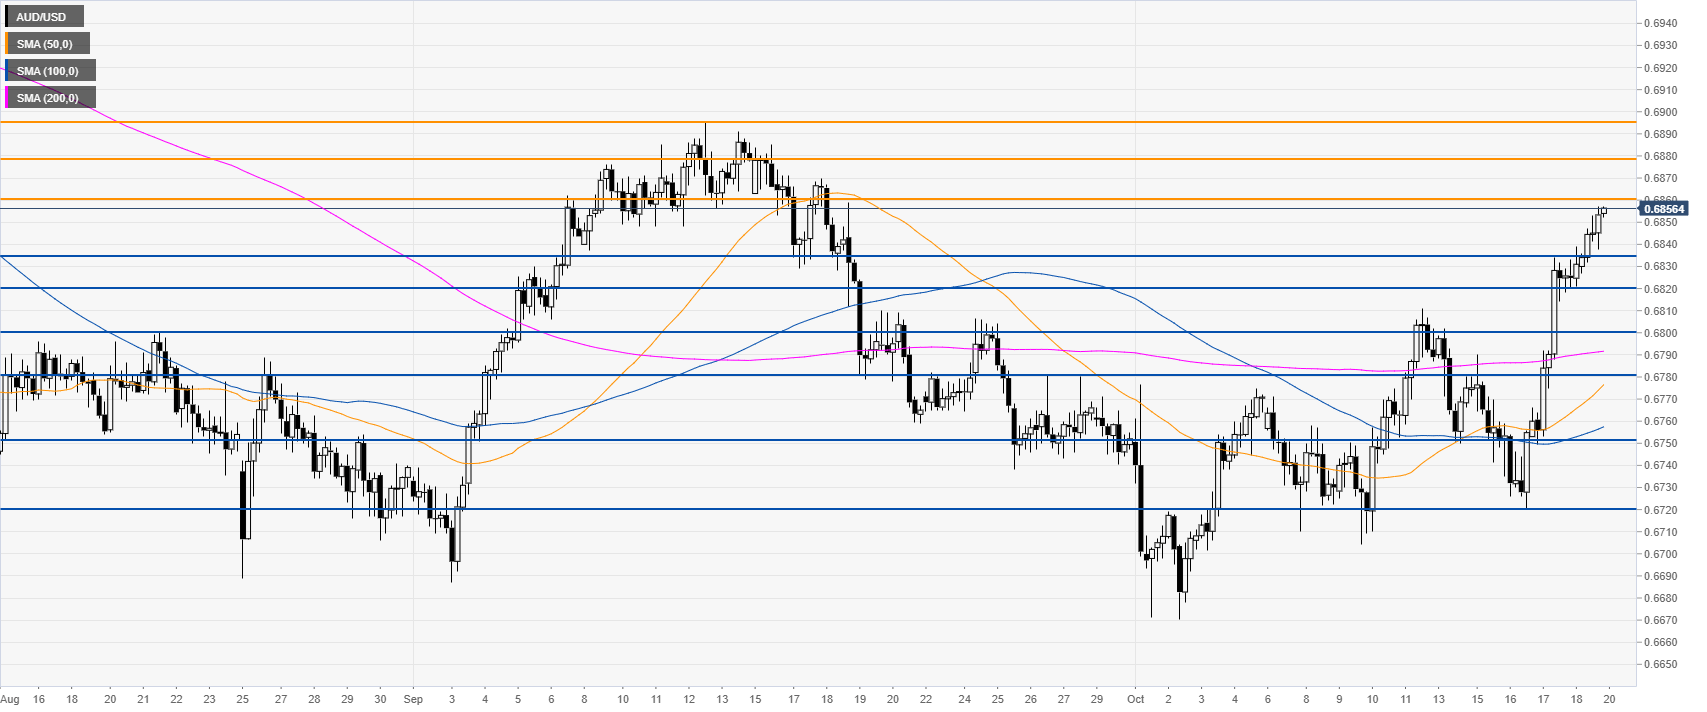
AUD/USD 4-hour chart
The market is trading above the main SMAs, suggesting a bullish momentum in the medium term. The spot is challenging the 0.6860 resistance while spiking to the upside. A break above the level can see the Aussie moving up to the 0.6860 and 0.6878 price levels, according to the Technical Confluences Indicator.
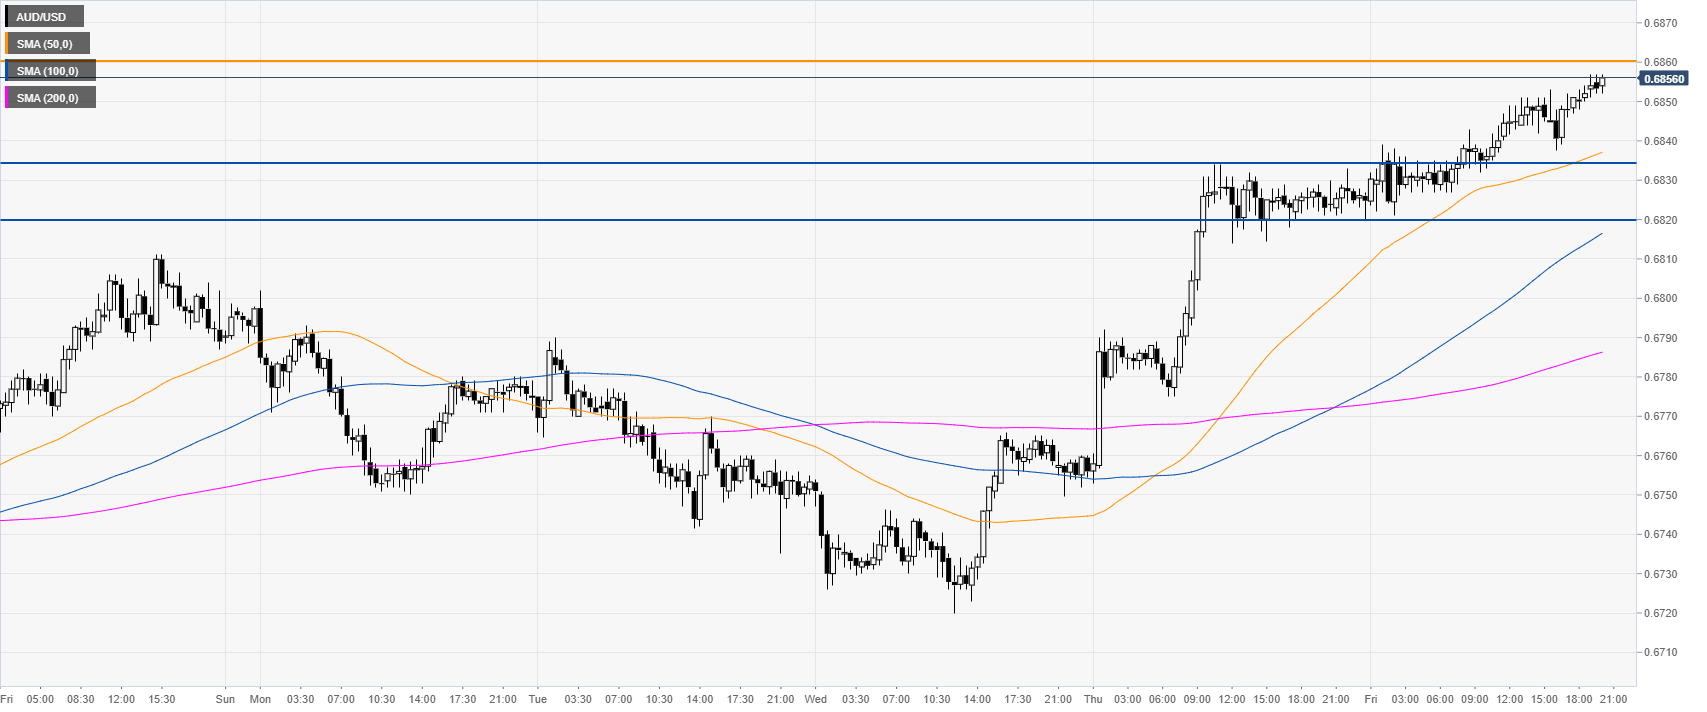
AUD/USD 30-minute chart
AUD/USD is trading above the main SMAs on the 30-minute chart, suggesting a bullish bias in the near term. Support is seen at the 0.6835 and 0.6820 price levels.
Additional key levels
