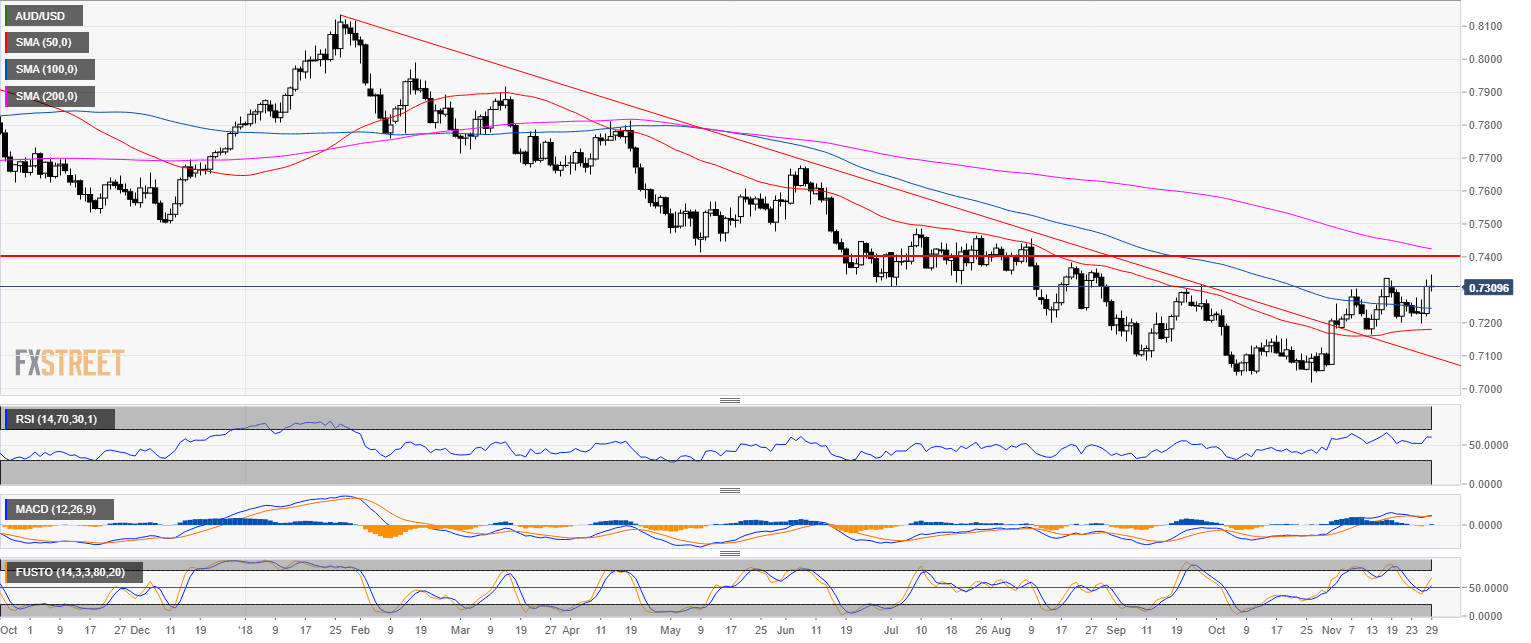
AUD/USD daily chart
- AUD/USD is trading in a bear trend below the 200-day simple moving average.
- However, bulls reclaimed the 50 and 100 SMA while technical indicators are gathering speed suggesting that the current bias might be to the upside.
- The FOMC minutes at 19.00 GMT are eagerly awaited by investors around the world as they can stir the US Dollar in one direction or another. Great caution is advised.
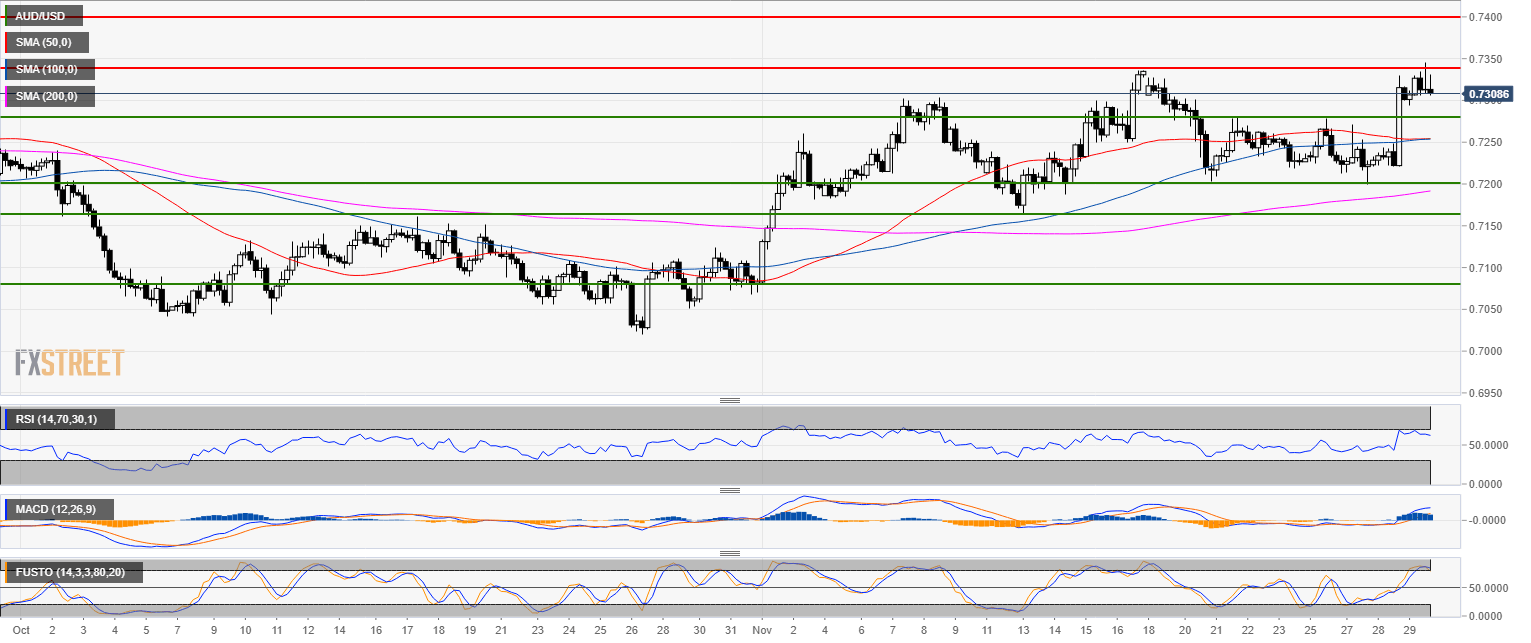
AUD/USD 4-hour chart
- AUD/USD has tested the 0.7340 resistance and is currently rejecting the level.
- Technical indicators are bullish although Stochastic is overbought.
- If bulls cannot sustain prices above 0.7340 then a deep pullback to 0.7220 can be on the cards.
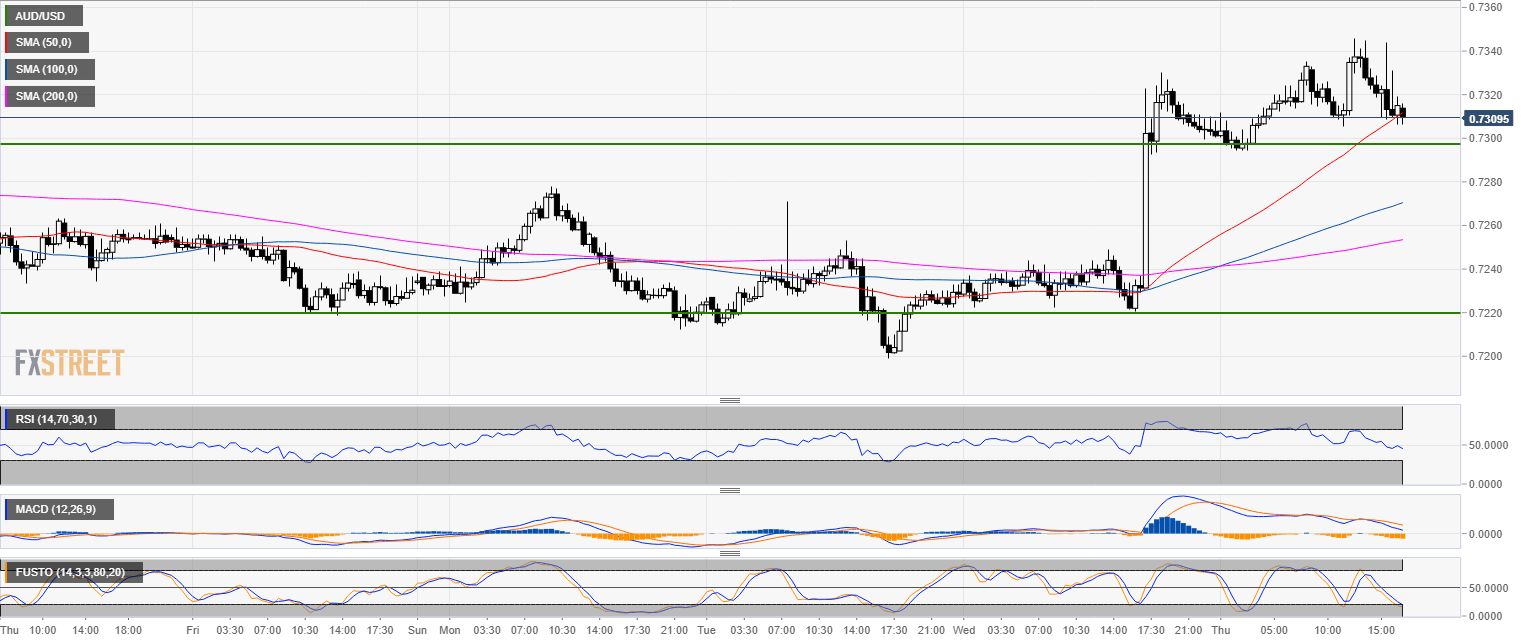
AUD/USD 30-minute chart
- AUD/USD is testing the 50 SMA and is now close to the 0.7300 figure.
- If bulls cannot support the market there, the next key support is seen at 0.7220 level.
- The bias remains to the upside with a potential target at 0.7400 figure.
Additional key levels
AUD/USD
Overview:
Today Last Price: 0.7309
Today Daily change: -2.0 pips
Today Daily change %: -0.0274%
Today Daily Open: 0.7311
Trends:
Previous Daily SMA20: 0.7243
Previous Daily SMA50: 0.718
Previous Daily SMA100: 0.7245
Previous Daily SMA200: 0.7429
Levels:
Previous Daily High: 0.7329
Previous Daily Low: 0.722
Previous Weekly High: 0.7327
Previous Weekly Low: 0.7202
Previous Monthly High: 0.724
Previous Monthly Low: 0.702
Previous Daily Fibonacci 38.2%: 0.7288
Previous Daily Fibonacci 61.8%: 0.7262
Previous Daily Pivot Point S1: 0.7244
Previous Daily Pivot Point S2: 0.7178
Previous Daily Pivot Point S3: 0.7136
Previous Daily Pivot Point R1: 0.7353
Previous Daily Pivot Point R2: 0.7395
Previous Daily Pivot Point R3: 0.7461
