- AUD/USD is challenging the monthly lows near 0.6871 support.
- The levels to beat for bears can be seen near 0.6857 and 0.6830.
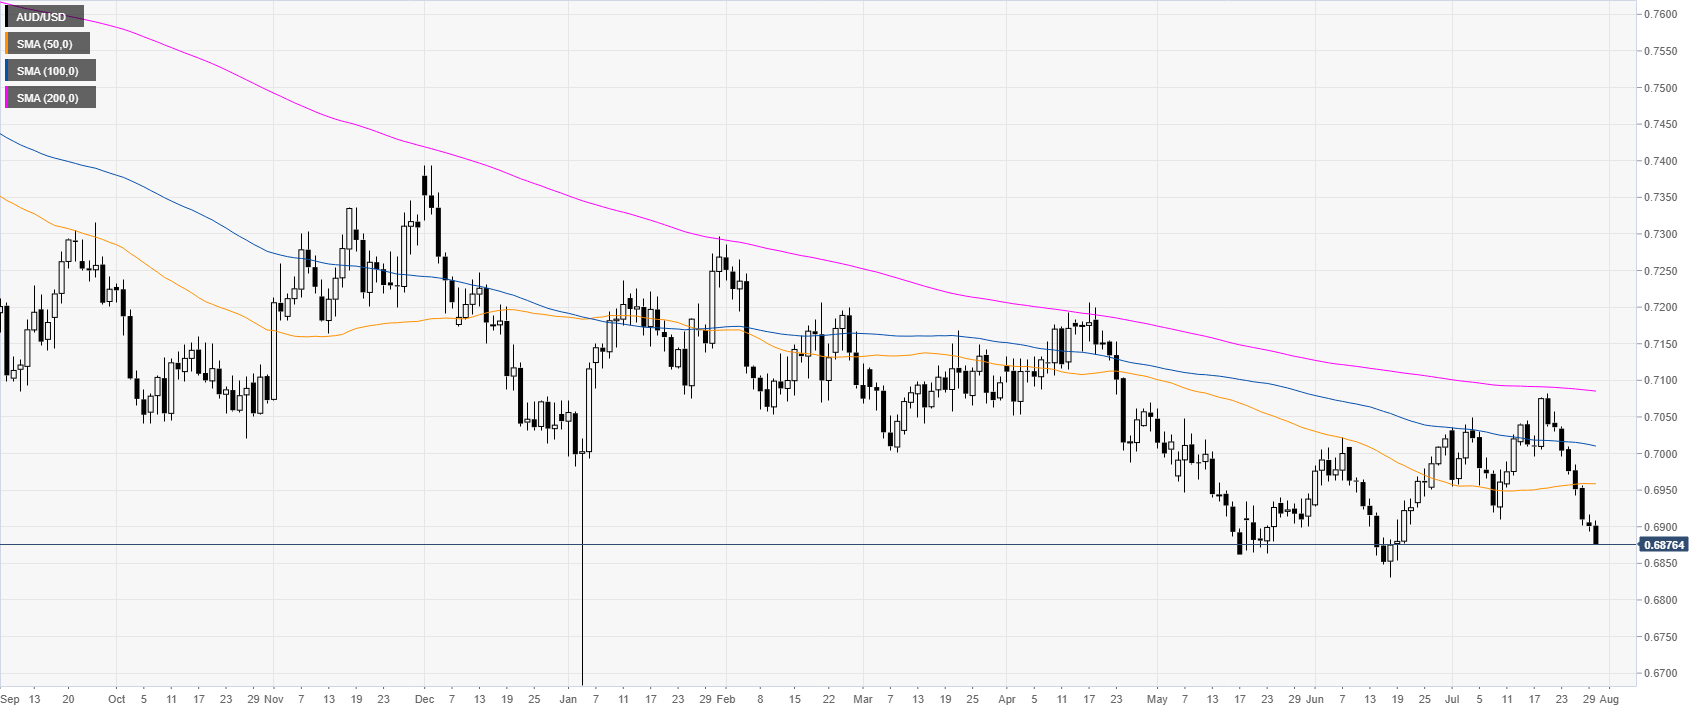
AUD/USD daily chart
The Aussie is in a bear trend trading below the main daily simple moving averages (DSMAs). The market is printing new July lows below the 0.6900 mark.
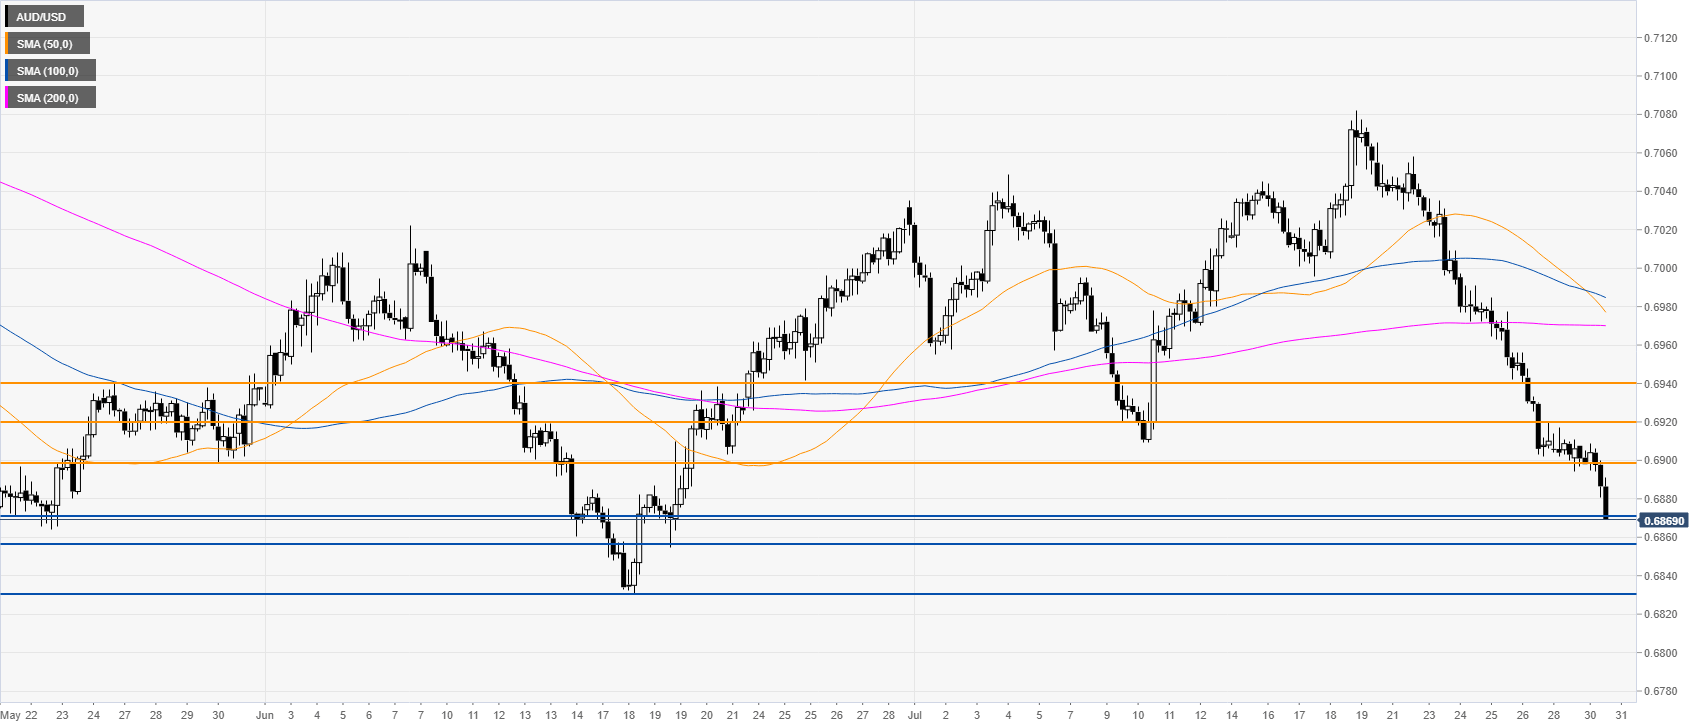
AUD/USD 4-hour chart
The Aussie is in free fall below its main SMAs as the market challenges the 0.6871 support. The bears are relentless and the market can continue to decline towards 0.6857 and the 0.6830 level according to the Technical Confluences Indicator.
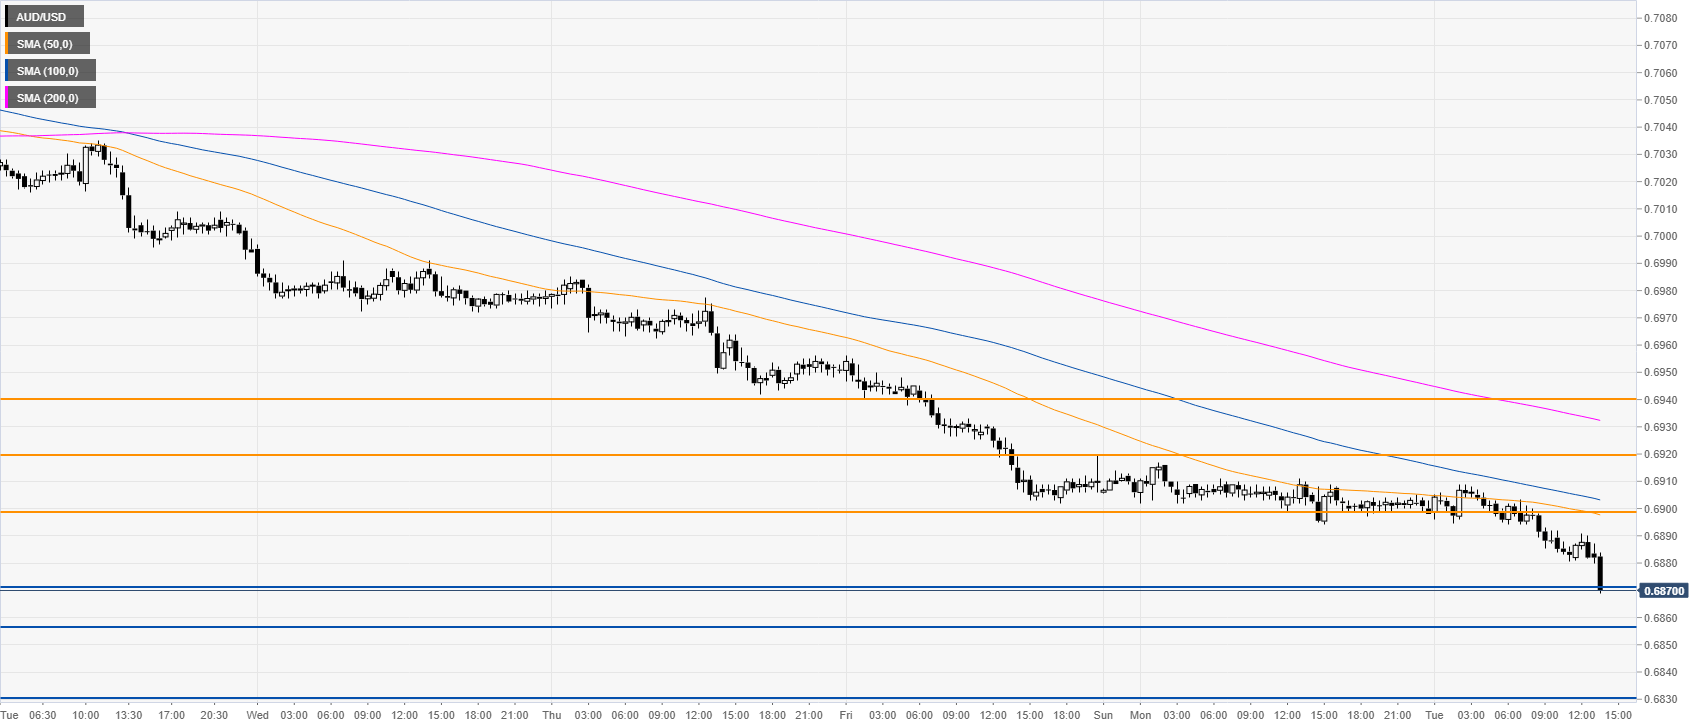
AUD/USD 30-minute chart
AUD/USD is trading below its main SMAs, suggesting bearish momentum in the near term. Immediate resistances can be seen near 0.6900, 0.6920 the 0.6940 level according to the Technical Confluences Indicator.
Additional key levels
