- The Aussie is losing steam on broad-based US Dollar strength.
- The level to beat for bears is the 0.6810 support.
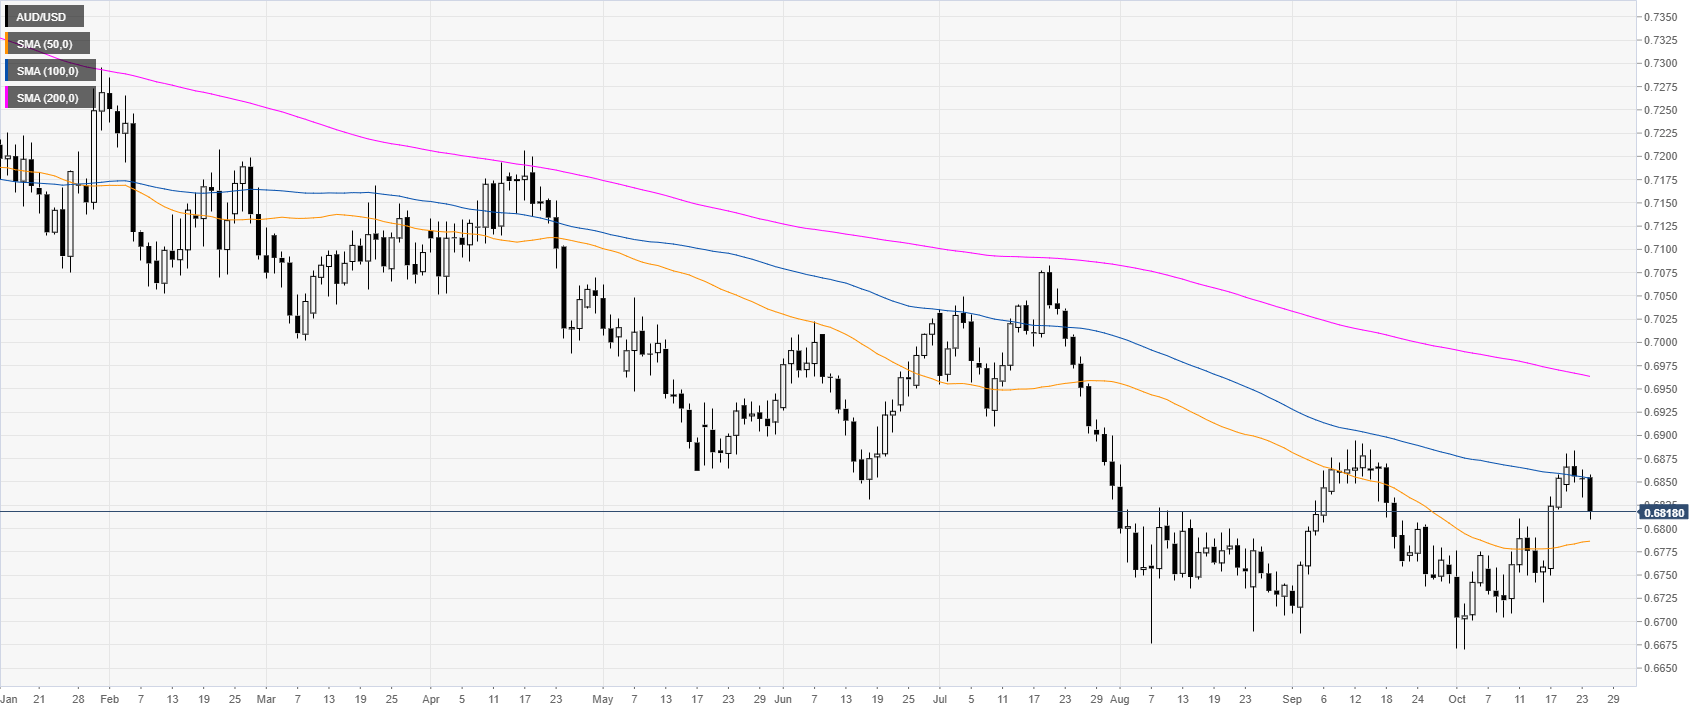
AUD/USD daily chart
The Aussie is trading in a bear trend below its 100 and 200-day simple moving averages (DMAs) on the daily chart. However, in October, the market has been bouncing sharply and managed to surpass the 100 SMA for a limited amount of time.
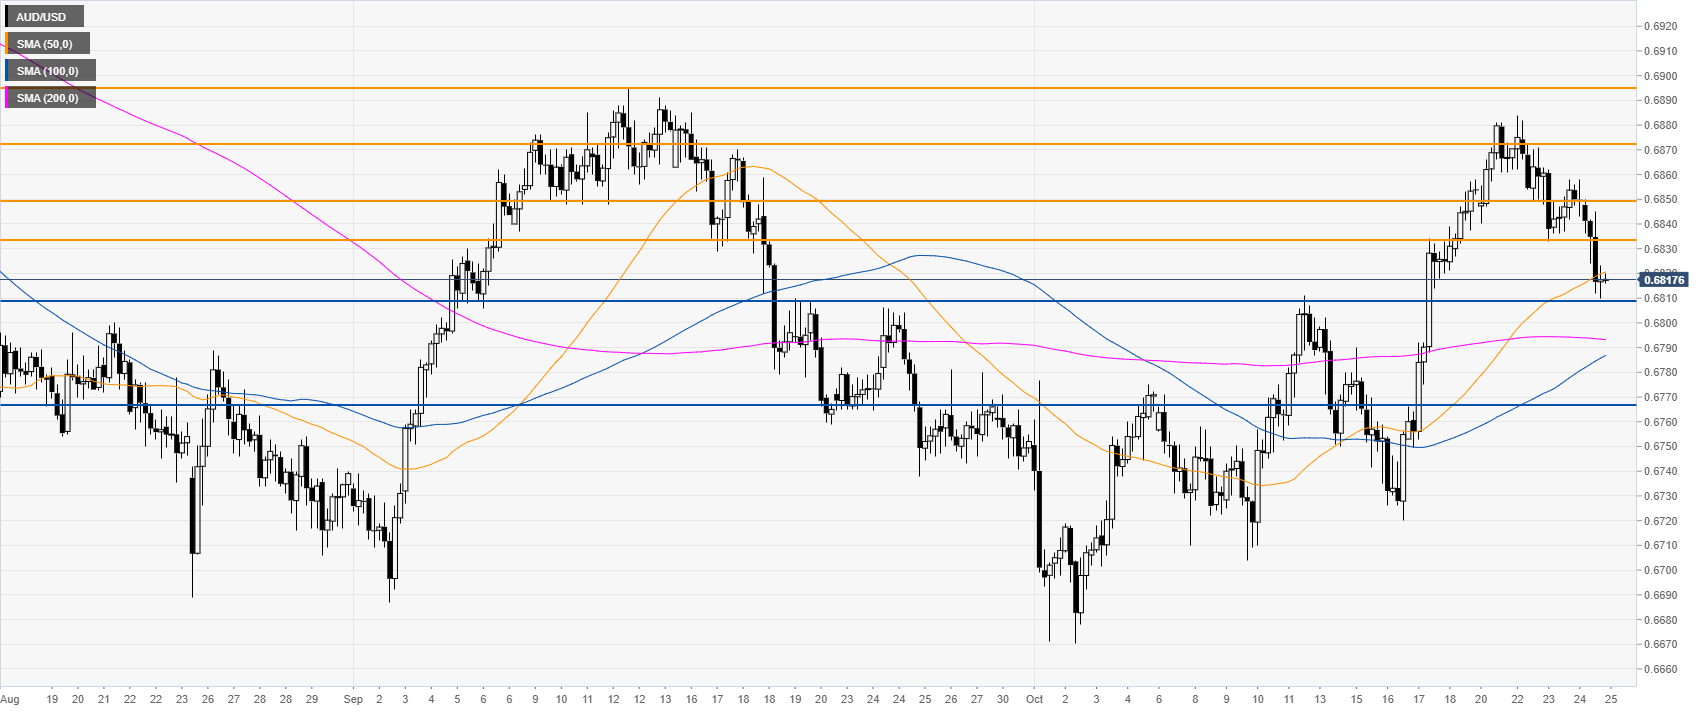
AUD/USD 4-hour chart
The market is challenging the 0.6810 support and the 50 SMA. The level to beat for bears is the 0.6810 support. A break below the level is necessary for the market to trade towards 0.6767, according to the Technical Confluences Indicator.
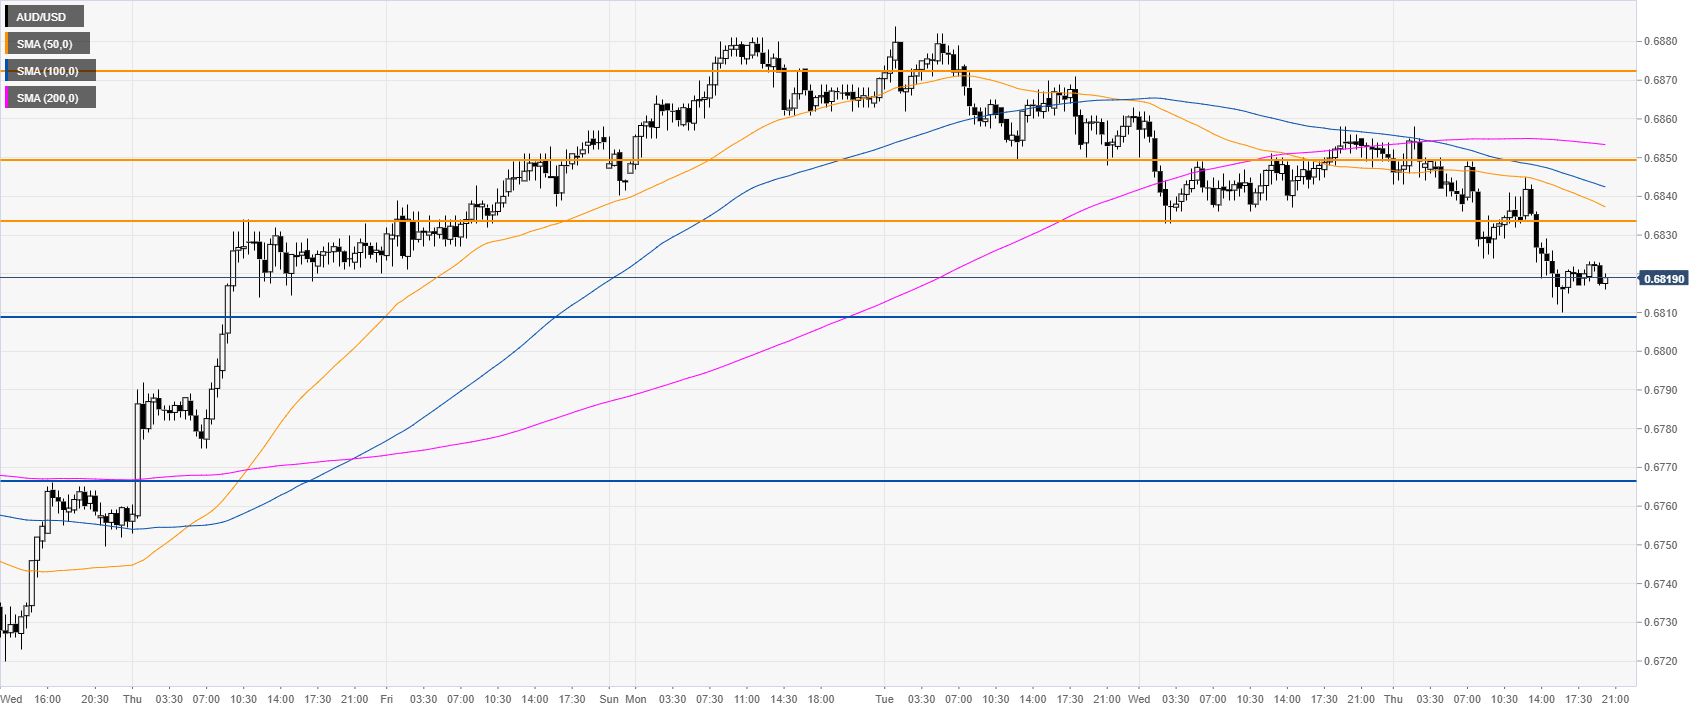
AUD/USD 30-minute chart
AUD/USD is trading below its main SMAs on the 30-minute chart, suggesting a bearish bias in the near term. Resistances are seen at the 0.6833 and 0.6850 price levels.
Additional key levels
