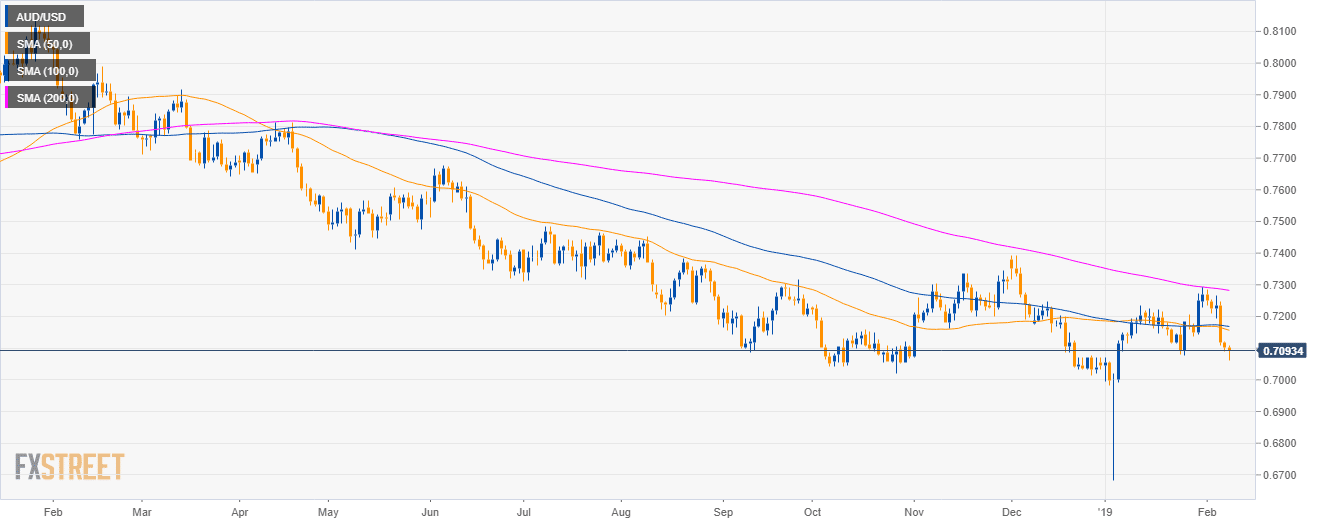
AUD/USD daily chart
- AUD/USD is trading in a bear trend below the 200-day simple moving average (SMA).
- AUD/USD is trading near the 2019 low.
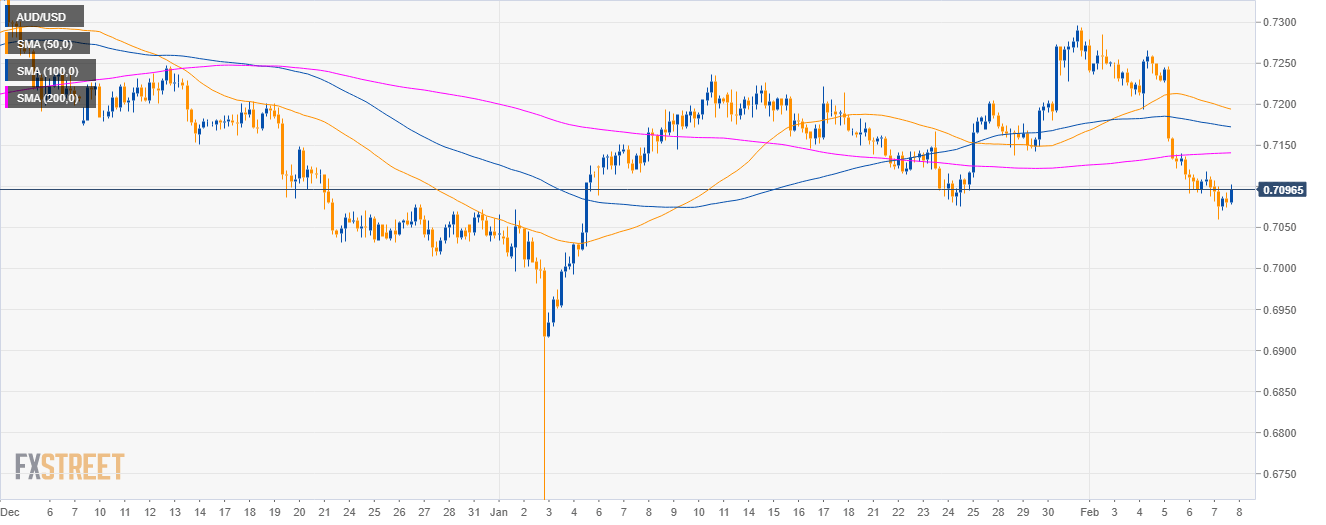
AUD/USD 4-hour chart
- AUD/USD is trading below its main SMAs suggesting bearish momentum in the medium-term.
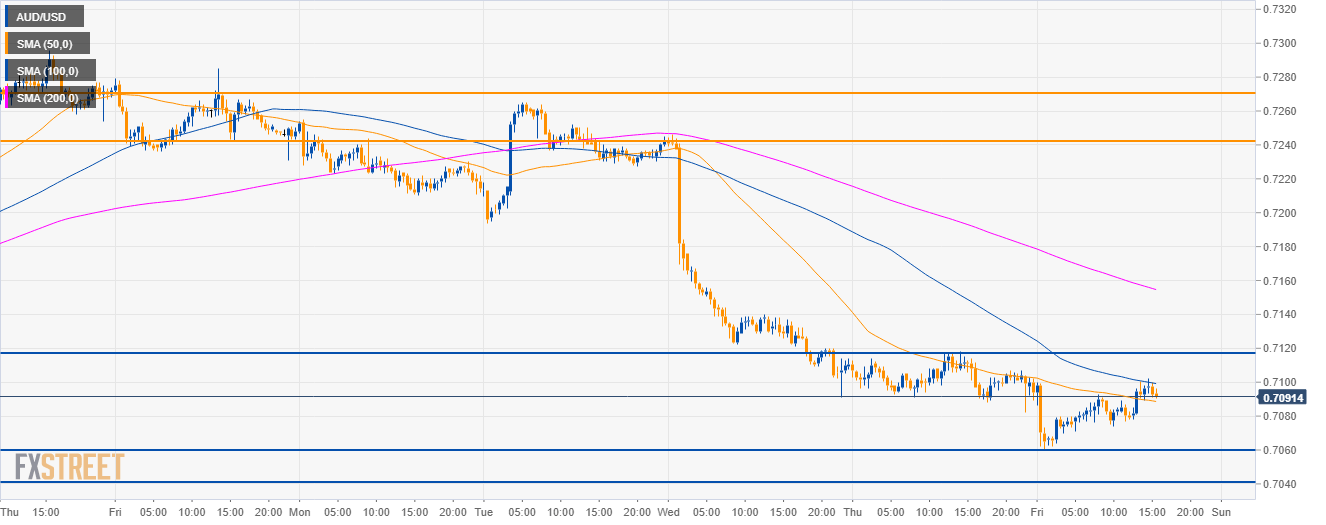
AUD/USD 30-minute chart
- Aussie is trading below its 100 and 200 SMAs suggesting bearish momentum in the short-term.
- Bears will need to overcome the 0.7060 support in order to travel to 0.7000 figure to the downside.
- On the flip side, the level to beat for bulls is 0.7120. A break of this resistance can lead to a recovery to 0.7240.
Additional key levels
AUD/USD
Overview:
Today Last Price: 0.7093
Today Daily change: -10 pips
Today Daily change %: -0.14%
Today Daily Open: 0.7103
Trends:
Daily SMA20: 0.718
Daily SMA50: 0.7161
Daily SMA100: 0.7171
Daily SMA200: 0.7285
Levels:
Previous Daily High: 0.712
Previous Daily Low: 0.7088
Previous Weekly High: 0.7296
Previous Weekly Low: 0.7138
Previous Monthly High: 0.7296
Previous Monthly Low: 0.6684
Daily Fibonacci 38.2%: 0.71
Daily Fibonacci 61.8%: 0.7108
Daily Pivot Point S1: 0.7087
Daily Pivot Point S2: 0.7072
Daily Pivot Point S3: 0.7055
Daily Pivot Point R1: 0.7119
Daily Pivot Point R2: 0.7136
Daily Pivot Point R3: 0.7151
