“¢ An unexpected fall in the Aussie unemployment rate helped the pair to break out of a short-term descending trend-channel formation on the 1-hourly chart.
“¢ The pair now seems to have entered a consolidation phase and trying to establish a firm near-term firm base above the 100-hour SMA amid a weaker tone surrounding the USD.
“¢ Technical indicators on the mentioned chart are holding in bullish territory and thus, increase prospects for further near-term recovery towards 200-hour SMA.
AUD/USD 1-hourly chart
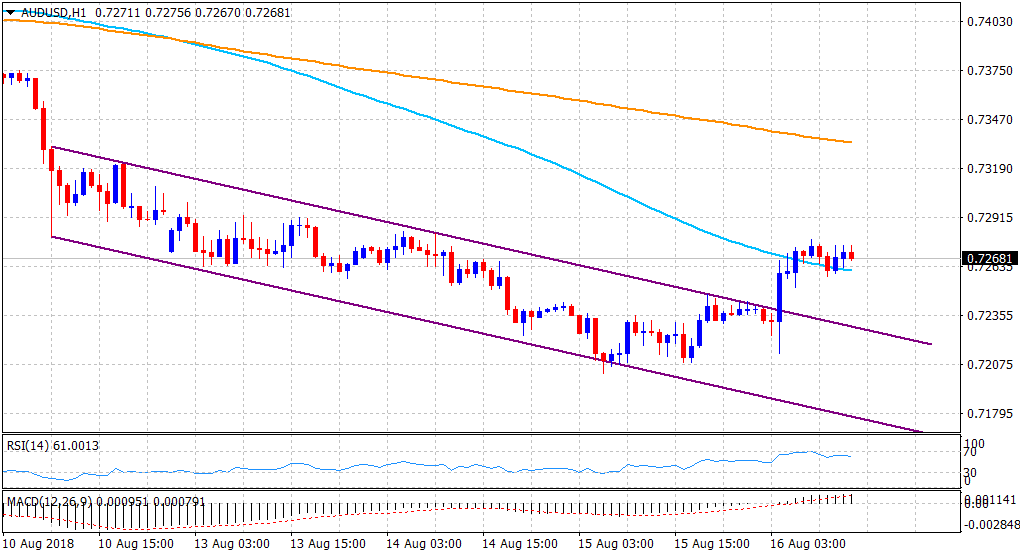
Spot Rate: 0.7268
Daily Low: 0.7214
Trend: Short-term bullish
Resistance
R1: 0.7300 (round figure mark)
R2: 0.7334 (200-period SMA H1)
R3: 0.7374 (20-day SMA)
Support
S1: 0.7230 (descending trend-channel resistance break-point)
S2: 0.7202 (near 20-month low set in the previous session)
S3: 0.7182 (S2 daily pivot-point)
