- AUD/USD revisits Tuesday’s low but short-term trend-line support can limit further declines.
- Symmetrical triangle portrays pair’s range-bound trading between 0.6765 and 0.6800.
Even after declining to two-day lows, the AUD/USD pair remains supported by an immediate symmetrical triangle as it trades near .6768 during early Thursday.
A week-old symmetrical triangle formation presently restricts the pair’s moves between 0.6765 and 0.6800. As a result, pair’s latest declines is likely to witness a pullback towards 50% Fibonacci retracement level of July 31 to August 07 declines, at 0.6789. However, the pair’s additional rise will be questioned by the triangle resistance of 0.6800.
In a case prices rally beyond 0.6800, 0.6820 and 0.6870 can quickly appear on the chart ahead of fueling the run-up towards July-end top of 0.6900.
Meanwhile, pair’s decline below 0.6765 support-line will extend the pair’s latest drop in the direction to last week’s low of 0.6736 whereas 0.6695 and 0.6677 can please bears afterward.
AUD/USD 4-hour chart
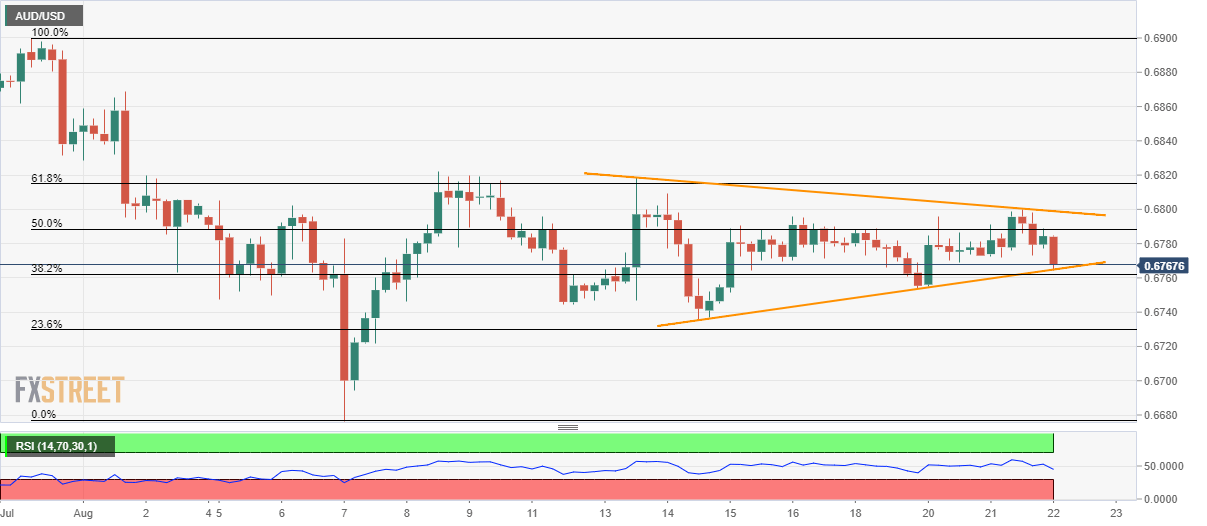
Trend: Sideways
