- AUD/USD bounces off 61.8% Fibonacci retracement of August-September upside.
- Immediate falling trend-line, 200-bar SMA can question the recovery amid oversold RSI.
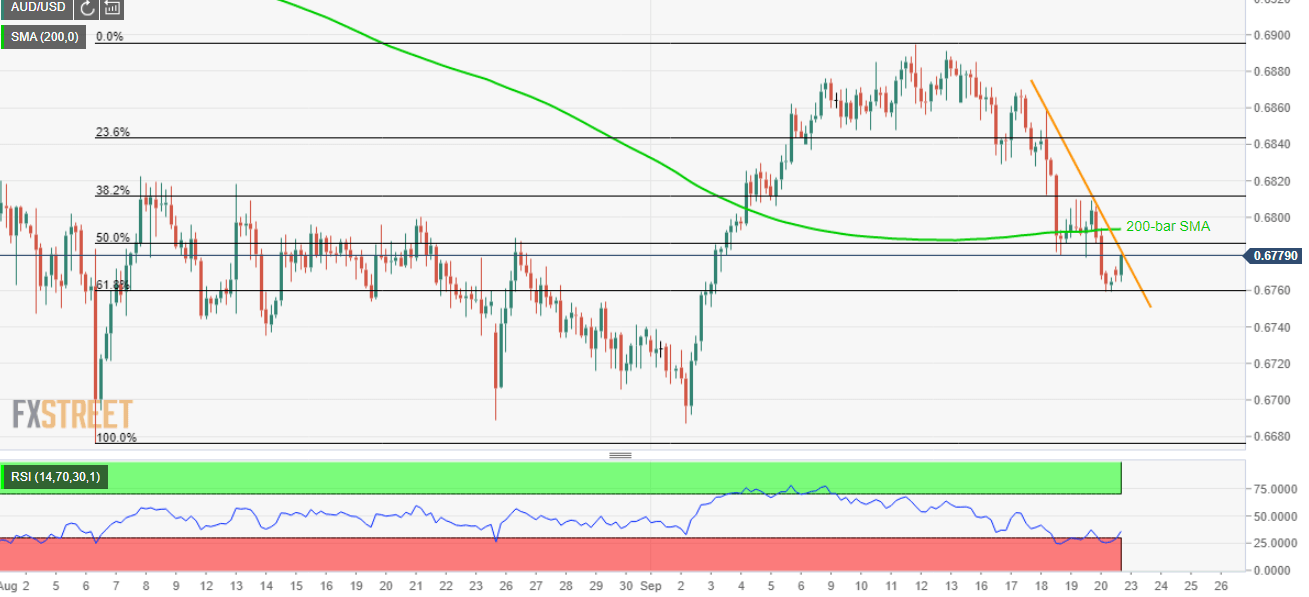
Although oversold conditions of 14-bar relative strength index (RSI) triggered the AUD/USD pair’s latest pullback, the quote still stays below near-term key resistances as it trades around 0.6780 during early Monday.
Challenging the upside is a downward sloping trend-line since Wednesday, at 0.6785, followed by 200-bar simple moving average (SMA) level near 0.6800.
In a case prices rally beyond 0.6800, 0.6830 and 0.68650 can entertain buyers ahead of pushing them to target monthly top nearing 0.6900.
On the flip side, pair’s declines below 61.8% Fibonacci retracement level of 0.6760 can revisit August-end highs surrounding 0.6740 whereas 0.6700, 0.6690 and 0.6675 may flash on sellers’ radar then after.
AUD/USD 4-hour chart
Trend: pullback expected
