- AUD/USD surges to a five-week high, confronts key resistance-area amid overbought RSI condition.
- Multiple highs since August 02, 38.2% Fibonacci retracement limit immediate upside.
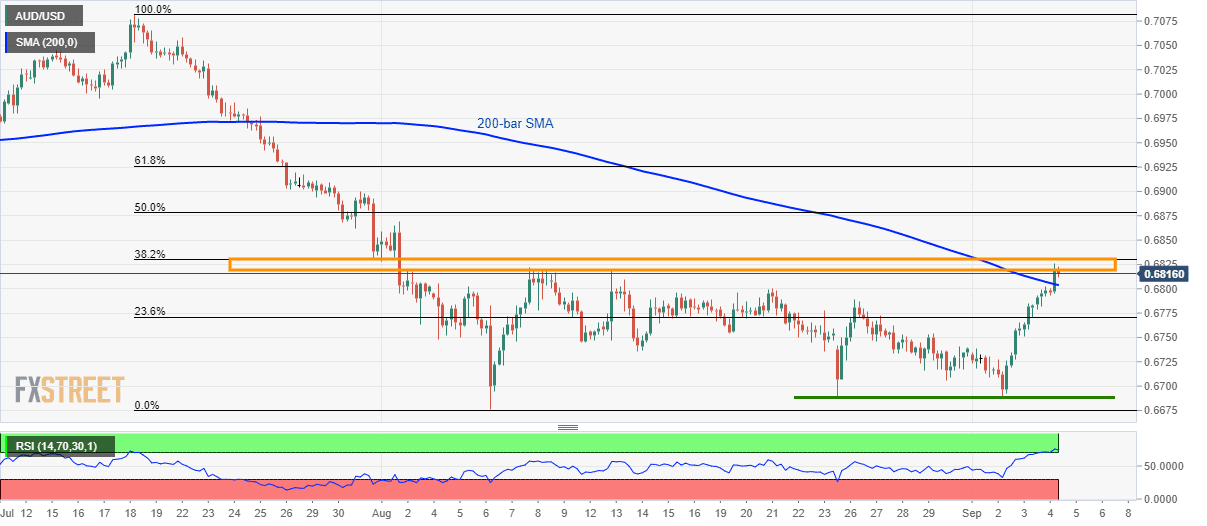
- 200-bar SMA acts as nearby support.
The AUD/USD pair’s latest run-up towards multi-day top catches a breath around 0.6820 before the European session begins on Thursday.
The pair seems to struggle in clearing the 0.6820/30 key resistance area that comprises of multiple highs marked since August 02 and 38.2% Fibonacci retracement level of July-August decline.
Adding challenges to the upside is overbought conditions of 14-bar relative strength index (RSI).
With this, sellers will look for a break below 200-bar simple moving average (SMA) level around 0.6800 to initiate fresh shorts targeting 23.6% Fibonacci retracement level of 0.6770. However, 0.6700 and horizontal support around 0.6690/85 could question pair’s further declines.
During the pair’s upside beyond 0.6830, August month high near 0.6870 and 61.8% Fibonacci retracement level close to 0.6930 will be the key to watch.
AUD/USD 4-hour chart
Trend: pullback expected
