AUDUSD has continued to trade higher post US pending home sales data. AUDUSD buyers pushed the pair towards the key 0.9300 resistance zone in the late Asian session. The pair has managed to register four back-to-back daily gains and looks set to record fifth one.
Weak US pending home sales
Yesterday, US pending home sales data was published by the National Association of Realtors in the NY session. The outcome was slated to register 0.3 percent gain, but the report suggested that US pending home sales dipped 0.8 percent to 93.9 in February from a downwardly revised 94.7 in January. This is one of the worst performances, as it is 10.5 percent below February 2013 reading. However, the sales market appears to be steadying, according to Lawrence Yun, NAR chief economist. He mentioned in the report that “contract signings for the past three months have been little changed, implying the market appears to be stabilizing”.
China hints Stimulus
Chinese PM Li Keqiang in a statement mentioned that the government is ready to act if required and if the current slowdown deteriorates. Chinese stimulus talks mostly help the AUDUSD pair to sustain the bullish move.
Technical Analysis
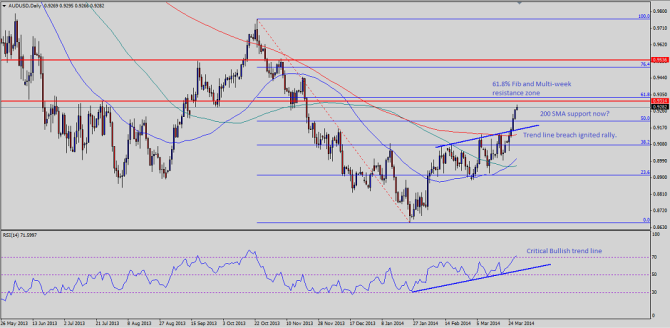
AUDUSD successfully managed to close above the 200-day simple moving average, as the sellers failed to defend the 50% retracement level of the down move from October 2013 top to the recent 0.8668 low. There pair also managed to climb above a trend line. After the break, bullish move gathered pace, as the pair challenged the 0.9300 level and traded as high as 0.9294 in the Asian session. There are several resistances around the 0.9300-9360 range. One of the most critical resistance levels is 61.8% Fibonacci retracement level. This resistance zone might well act as a crucial barrier for the pair.
The broken trend line and 200-day SMA might act as support in the short term. Most indicators on the daily timeframe suggesting overbought conditions, which can result in a pullback. However, there is a bullish trend line forming on the RSI waiting to act as a support for the pair.